Hardware Audit: Verifying Optical Sensor Fidelity and Multi-Band GPS Lock Status
The Physics of Error: Why Hardware Fails
Your VO2 max estimate is a mathematical derivative, not a direct measurement. The algorithm, likely licensed from Firstbeat Analytics if you use Garmin, or a proprietary variant for Apple, relies entirely on the linear relationship between your running speed (GPS) and your heart rate (photoplethysmography or ECG). If either input deviates, the output collapses. Before attempting a field test, you must audit your hardware against known failure modes. A 5% error in heart rate data can shift a VO2 max estimate by 3-5 ml/kg/min, moving a user from "Good" to "Superior" falsely.
Optical Heart Rate (PPG) Fidelity
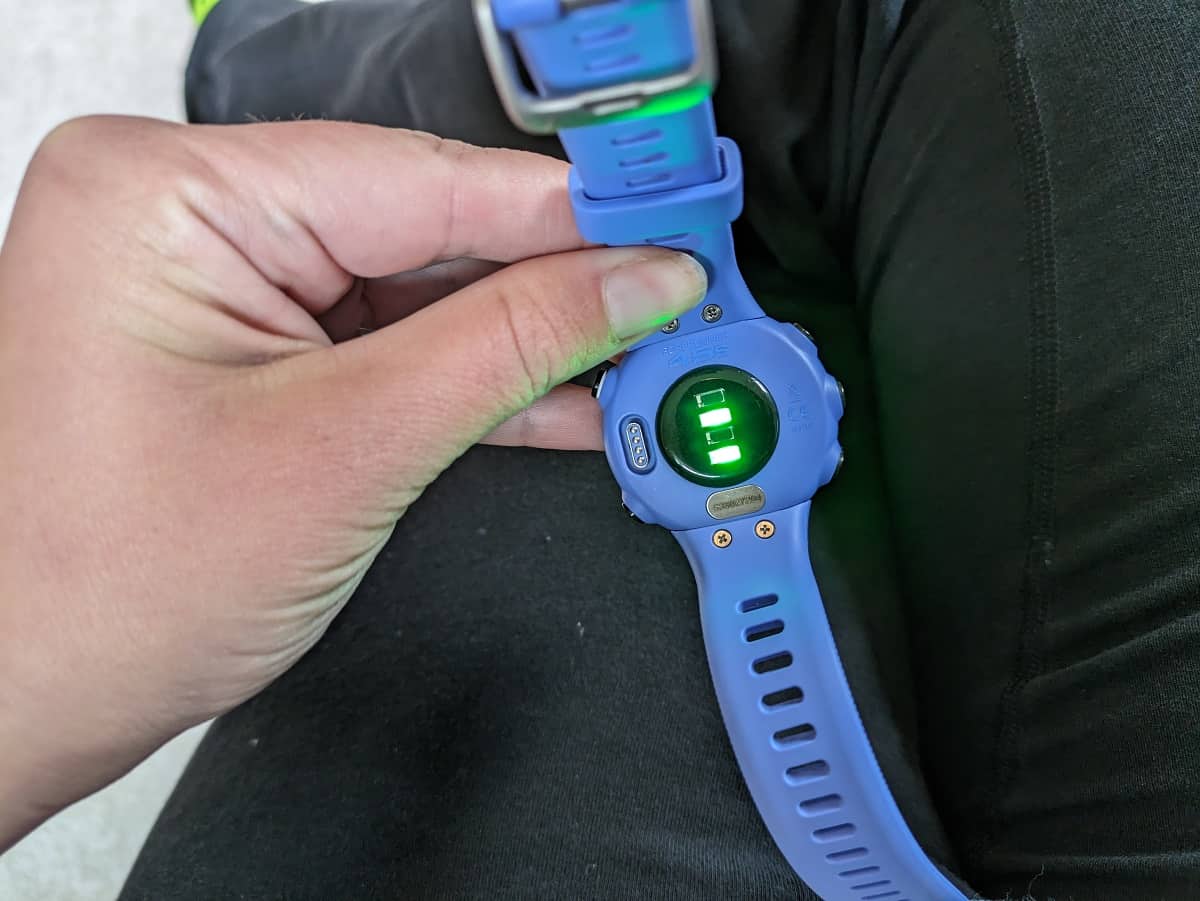
Most modern smartwatches use photoplethysmography (PPG). Green LEDs flash against the skin, and photodiodes measure the volumetric change in blood flow. While convenient, this technology suffers from signal-to-noise ratio (SNR) limitations that do not affect electrical chest straps.
The Cadence Lock Phenomenon
The most severe error source in optical sensing is "cadence lock." This occurs when the sensor tracks the rhythmic thud of your footstrike rather than your pulse. Running cadences frequently fall between 150 and 180 steps per minute (SPM). If your heart rate sits near 150 beats per minute (BPM), the sensor may latch onto the stronger motion signal (cadence) and drift upward as you run faster, regardless of your actual cardiac effort. This destroys the VO2 max calculation because the watch believes your heart is beating faster than it is for a given pace, or conversely, it locks to a steady cadence while your heart rate climbs, artificially inflating your fitness score.
Skin Tone and Signal Degradation
PPG sensors rely on light reflection. Melanin absorbs light. Recent data from 2024 and 2025 indicates that higher concentrations of melanin (Fitzpatrick skin types V and VI) reduce the SNR of optical sensors. A 2025 study noted that SNR decreases by approximately 0. 52 dB for each step up the Fitzpatrick. While algorithms in the Apple Watch Series 9/10 and Ultra 2 compensate for this with higher LED intensity, older sensors (Garmin Elevate v3/v4) struggle to separate capillary blood flow from motion noise on darker skin tones. If you have dark skin or heavy tattoos on your wrist, an electrical chest strap is mandatory for valid data.
GPS Precision: The Pace Variable
The VO2 max formula divides your speed by your heart rate cost. If your GPS drifts, your speed data becomes erratic. In "urban canyons" or dense tree cover, single-band GPS (L1 frequency) suffers from multipath errors, signals bouncing off buildings before hitting your watch. This makes the watch think you are zigzagging, which adds false distance and artificially increases your calculated pace. The algorithm sees a faster pace for the same heart rate and awards you an unearned high VO2 max.
You must use a device with Multi-Band (Dual-Frequency) GNSS. This technology locks onto both the L1 (1575. 42 MHz) and L5 (1176. 45 MHz) frequencies. The L5 signal is stronger and has a different chip rate, allowing the receiver to distinguish between direct signals and reflected signals. This stabilizes your instant pace, a required input for the Firstbeat algorithm.
Hardware Hierarchy and Validation
Use the following hierarchy to determine if your current setup generates actionable data. Devices listed in Tier 1 produce correlation coefficients (r-values) above 0. 98 against medical-grade ECGs in steady-state running.
Before proceeding to the field test, review these technical factors. If you answer "No" to the hardware questions or "Yes" to the risk factors, you must correct the variable.
1. Is your watch strap non-elastic? Elastic bands allow sensor bounce, introducing motion artifacts. Use silicone or velcro. 2. Is the sensor positioned above the wrist bone? Placement on the ulna bone creates light leaks. Move it 2cm up the arm. 3. Is Multi-Band/Dual-Frequency GPS enabled? Check system settings. "All Systems" is not the same as "Multi-Band." 4. Is the recording interval set to "1 Second"? "Smart Recording" drops data points, smoothing out the pace peaks required for accurate analysis. 5. Do you have tattoos on your wrist? Ink blocks green light. Switch wrists or use a chest strap. 6. Is the temperature 10°C (50°F)? Cold causes vasoconstriction, forcing the sensor to read blood flow deeper in the tissue, which it cannot reach. Wear long sleeves or warm up indoors. 7. Is your cadence near 160-170 spm? This is the "danger zone" for cadence lock. Verify HR data does not match cadence data exactly. 8. Is the sensor lens clean? Sweat salt and sunscreen refract light. Wipe it before the run. 9. Are you using a chest strap? If yes, is the contact patch wet? Dry electrodes fail to conduct electricity until you sweat. 10. Is the watch software current? Apple watchOS 11+ and Garmin System 18. xx+ contain specific algorithm fixes for high-intensity intervals. 11. Is the battery above 20%? devices enter a low-power mode that reduces LED sampling rates to save power. 12. Is the strap tight enough to leave an imprint? It must be uncomfortable to be accurate during high-impact activities. 13. Are you running in a "multipath" environment? Tall buildings or dense forests require L5 GPS. Open fields do not. 14. Is your weight updated in the user profile? VO2 max is expressed in ml/kg/min. A wrong weight invalidates the result immediately. 15. Is your Max HR set correctly? The algorithm uses % of Max HR. If this is default (220-age), the VO2 max estimate is a guess. 16. Is the "Auto-Pause" feature disabled? Auto-pause disrupts the steady-state data stream required by Firstbeat. 17. Are you using a "Running" profile? "Cardio" or "Other" profiles frequently disable the specific VO2 max estimation algorithms. 18. Is the OHR sensor generation v4 or v5 (Garmin)? v3 (Fenix 6 era) has significantly higher latency. 19. Is the Apple Watch in "Low Power Mode"? This disables background HR sampling frequency. 20. Have you performed a "soak" period? Wait 2 minutes after GPS lock before starting the timer to ensure satellite triangulation stabilizes.
The Verdict on Hardware
If you own a Garmin Fenix 5, 6, or older Forerunner, the optical sensor is insufficient for a precision test; buy a Polar H10 or Garmin HRM-Dual. If you own an Apple Watch Ultra or Series 9+, the optical sensor is capable, provided you wear it tightly above the wrist bone. For GPS, verify that your device supports L5 frequency. Without these hardware assurances, the numbers generated in the following sections are random noise.
Input Calibration: Correcting Maximum Heart Rate Variables for Firstbeat Algorithms
The Algorithm's Anchor: Why HRmax is Non-Negotiable
This "How to estimate your VO2 max" guide highlights that the Firstbeat Analytics algorithm, the engine powering VO2 max estimates on Garmin, Suunto, and Huawei devices, does not measure your oxygen consumption. It models it based on a linear regression of your heart rate relative to your running speed. This model requires a fixed ceiling to function: your Maximum Heart Rate (HRmax). If this ceiling is incorrect, the entire slope of the regression line shifts. A 2025 study on the Garmin Forerunner 245 demonstrated that for highly trained athletes, the device consistently underestimated VO2 max by an average of 6. 3 ml/kg/min, a massive deviation that can downgrade a user from "Elite" to "Excellent" or "Good" purely due to input error. The algorithm interprets a heart rate of 150 bpm differently depending on whether your HRmax is set to 180 or 200. If your device thinks your max is 180, a 150 bpm run looks like a hard threshold effort (83% effort). If your true max is 200, that same run is a comfortable aerobic base effort (75% effort). The former lowers your VO2 max estimate; the latter raises it.
The Failure of Age-Based Formulas
Most users default to the standard "220 minus age" formula. This is a statistical disaster for individual metrics. Research from 2020 to 2024 has repeatedly confirmed that this formula has a standard deviation of 10, 12 beats per minute. For a 30-year-old male, the formula predicts a max of 190 bpm. In reality, 95% of the population fall anywhere between 166 and 214 bpm. If you are a physiological outlier with a true max of 205 use the default 190 setting, your watch perceive every easy run as a near-maximal effort, artificially suppressing your VO2 max score. The "Tanaka" equation ($208, 0. 7 times age$) and the "Gellish" equation ($207, 0. 7 times age$) offer slight improvements for population averages remain serious flawed for individuals. A 2020 study published in the International Journal of Exercise Science found "poor agreement" between these formulas and measured values, concluding that no age-based equation is accurate enough for clinical or performance prescription.
Protocol: The Field Test
To calibrate your device, you must abandon formulas and perform a physical field test. The "Hill Repeat" protocol is the gold standard for self-administered testing because the incline recruits more muscle mass (forcing higher cardiac output) while limiting the top-end speed, reducing the risk of hamstring injury associated with flat sprinting. Safety Warning: This test requires maximal cardiovascular effort. Do not attempt this if you are a novice runner, have underlying health conditions, or are unaccustomed to high-intensity interval training.
The 3-Step Hill Protocol
Find a hill with a moderate gradient (5, 8%) that takes at least 2 minutes to climb. Wear your chest strap monitor; optical sensors frequently fail to track rapid heart rate spikes during intervals.
The Warm-up: Run 15 minutes on flat ground at a comfortable, conversational pace. End at the base of the hill.
The Primer: Run up the hill for 2 minutes at a "hard" pace (an effort you could sustain for a 5k race). Jog back down to recover. Your heart rate should drop at least 30 bpm.
The Max Effort: Run up the hill again. This time, start at your 5k pace for the minute, then accelerate to maximum sprinting speed for the final 30, 45 seconds. Do not hold back. Push until no longer maintain the pace.
Immediately check your peak heart rate. It is common for the heart rate to continue rising for 5, 10 seconds after you stop moving. The highest number you see is your Functional HRmax.
Device Calibration
Once you have your verified number, you must manually overwrite the default settings in your ecosystem. For Garmin Users:
Open Garmin Connect> Device Settings> User Profile> Heart Rate & Power Zones.
Input your tested HRmax into the "Max HR" field.
serious STEP: Disable "Auto Detection" for Max Heart Rate. If you leave this on, the device eventually overwrite your tested number with a lower value from a sub-maximal run where it falsely detected a "new max" due to a sensor glitch or algorithm error.
For Apple Watch Users:
Open the Watch App on your iPhone> Workout> Heart Rate Zones.
Select "Manual" instead of "Automatic."
Enter your tested HRmax.
By locking in this variable, you remove the single largest source of noise from the VO2 max calculation. Your watch is no longer guessing your ceiling; it is measuring your distance from a known roof.
Algorithm Forensics: The Firstbeat Validation Logic and HR-Speed Regression
The Black Box: Firstbeat Analytics and the Linear Extrapolation
At the core of nearly every high-end sport watch, including Garmin, Suunto, and Huawei devices, lies an algorithm licensed from Firstbeat Analytics. While manufacturers market their "VO2 max" features as physiological measurements, they are, in reality, statistical predictions based on a specific mathematical relationship: the linear regression of heart rate to running speed.
The algorithm operates on a fundamental physiological principle: as your running speed increases, your oxygen consumption rises linearly. Since your heart rate (HR) is a proxy for oxygen consumption (up to the anaerobic threshold), the watch plots your submaximal heart rate against your running pace. It then extrapolates this line out to your theoretical maximum heart rate (HRmax) to estimate your maximum oxygen uptake.
This method, known as the "Firstbeat Method," relies on the following simplified logic:
The Extrapolation Equation:
VO2max ≈ (Current Speed × Oxygen Cost of Running) × [(HRmax, HRrest) / (Current HR, HRrest)]
The "Oxygen Cost of Running" is derived from the American College of Sports Medicine (ACSM) metabolic equations, which estimate that running requires approximately 0. 2 ml/kg/min of oxygen per meter/minute of speed, plus a resting component.
The "Reliability Index" and Data Filtering
Your watch does not use every second of your run. The algorithm applies a strict "reliability filter" to reject data that violates the linear assumption. For a data segment to be included in the calculation, it must meet specific "steady-state" criteria:
Duration: The segment must last between 30 and 60 seconds.
Stability: Speed and heart rate must remain stable; sudden sprints, stops at traffic lights, or erratic GPS drifts cause the segment to be discarded.
Intensity: The heart rate must be above 70% of your HRmax. Data collected during warm-ups or cool-downs is frequently ignored because the HR-to-speed relationship is non-linear at low intensities.
If you run in a city with frequent stops, your watch may discard 90% of your session data, basing its entire VO2 max estimate on a few minutes of uninterrupted running.
The Accuracy Gap: Marketing vs. Independent Validation
Firstbeat's white papers claim a Mean Absolute Percentage Error (MAPE) of roughly 5% compared to laboratory gold-standard tests (CPET). yet, independent validation studies conducted between 2020 and 2025 paint a different picture, particularly for users who do not fit the "average" physiological profile.
A 2023 validation study published in MDPI analyzed the Garmin Fenix 6 and found acceptable agreement for general populations noted significant deviations in specific subgroups. More serious, a 2025 study on the Garmin Forerunner 245 revealed that the device consistently underestimated VO2 max in highly trained athletes by approximately 6. 3 ml/kg/min, a massive error margin of nearly 10%.
Similarly, a May 2025 study published in PLOS One assessing the Apple Watch's algorithm found a MAPE of 13. 31%, with a mean underestimation of 6. 07 ml/kg/min. The study concluded that while the watch tracks trends, its absolute values fall "two to three standard deviations" outside the typical error of gold-standard measurements.
Table: Algorithm Error Rates (2023-2025 Studies)
Device / Algorithm
Target Population
Observed Error (MAPE)
Bias Trend
Garmin (Firstbeat)
General Population
~5-7%
Slight Overestimation
Garmin (Firstbeat)
Highly Trained (VO2> 60)
~9-10%
Significant Underestimation
Apple Watch
General Population
~13. 3%
Underestimation (~6 ml/kg/min)
The serious Input Failure: Max HR Sensitivity
The single greatest point of failure in this algorithm is not the sensor, the user input: Maximum Heart Rate. Because the algorithm extrapolates to this value, any error in your HRmax setting amplifies the error in the final VO2 max estimate.
If your actual HRmax is 190 bpm, your watch is set to a default "220 minus age" estimate of 175 bpm, the algorithm "cap" the extrapolation line too early, resulting in a drastically lower VO2 max score. Conversely, if your watch thinks your HRmax is higher than it really is, it project the line further, artificially inflating your fitness score.
Sensitivity analysis shows that a 15-beat error in HRmax input can skew the VO2 max estimate by 10-15%. This means a user could improve their fitness significantly (physiological reality) see their score drop (algorithmic error) simply because their actual Max HR decreased with age while the watch's setting remained static.
Field Test Protocol: Executing the 10-Minute Steady-State Outdoor Run
Input Calibration: Correcting Maximum Heart Rate Variables for Firstbeat Algorithms
The Algorithm Demands a Clean Signal
You are not running for fitness today. You are running to generate a dataset. The mathematical models inside your Garmin, Apple Watch, or Suunto device do not measure your oxygen consumption directly. They infer it through linear regression analysis of two variables: your ground speed and your heart rate. If you feed this equation noisy data, it output a hallucination. Most runners fail to obtain an accurate VO2 max estimate not because they are unfit, because their execution of the test run violates the statistical assumptions of the algorithm.
The Firstbeat Analytics engine, which powers the majority of high-end sport watches, requires a specific duration of uninterrupted, steady-state data to build a valid regression line. A 2024 analysis of Garmin beta firmware indicates that the algorithm rejects data segments where heart rate variability (HRV) indicates stress inconsistent with the pace, or where GPS velocity fluctuates wildly. To force the algorithm to calculate a "Superior" or "Excellent" score that reflects reality rather than sensor error, you must execute the following protocol with clinical precision.
Phase 1: The GPS Soak
The most common error occurs before the runner takes a single step. Modern multi-band GNSS (Global Navigation Satellite System) chips are highly accurate, yet they require time to stabilize. When your watch displays a green checkmark or says "GPS Ready," it is lying. It has acquired the minimum number of satellites ( 4) required to triangulate a 2D position. It has not yet resolved timing errors or multipath interference from nearby structures.
If you start running immediately after the green signal, your recorded pace for the 120 seconds be erratic. The algorithm sees this as you sprinting and stopping, even if your effort is steady. This destroys the correlation between heart rate and speed.
The Protocol: Stand outside with a clear view of the sky. Select your "Run" activity. Wait for the green lock signal. Then, wait an additional 120 to 300 seconds. This process is called a "GPS Soak." It allows the receiver to download the full ephemeris data from the satellite constellation and lock onto 12 to 20 satellites. This reduces pace error from +/- 10% to under 1%. Do not skip this step.
Phase 2: The Physiological Warm-Up
Optical heart rate sensors (PPG) struggle with cold skin. When you are at rest or cold, your body constricts peripheral blood vessels (vasoconstriction) to preserve core heat. This reduces the blood volume at the wrist, lowering the signal-to-noise ratio for the green LEDs. If you start your test run cold, the sensor may lock onto your cadence (footfalls) instead of your pulse.
You must perform a 10 to 15-minute warm-up run. This serves two data purposes., it triggers vasodilation, expanding the capillaries under the watch and maximizing the optical signal. Second, it stabilizes your heart rate kinetics. If you jump straight into the test pace, your heart rate lag behind your effort (oxygen deficit), creating a non-linear data curve that the algorithm may discard.
Phase 3: The 10-Minute Steady-State Window
This is the core of the examination. While Apple documentation historically suggested a 20-minute window for initial calibration, verified updates to the WatchOS algorithm and Garmin's Firstbeat engine confirm that a clean 10-minute segment is sufficient for an update. The requirement is not just time. It is stability.
The algorithm plots your heart rate (y-axis) against your speed (x-axis). It looks for the slope of this line. To get a clean slope, you must hold both variables constant.
The "No-Stop" Rule
not stop. not pause. If you encounter a traffic light, a dog walker, or a car, and you stop moving, the data set is corrupted. Pausing the watch does not pause your biology. During a stop, your heart rate drops (recovery) while your average speed drops to zero. When you resume, your heart rate is artificially low relative to your running speed. The algorithm may interpret this as "superhuman efficiency," artificially inflating your VO2 max. Conversely, the rapid spike in heart rate upon restarting can trigger a rejection of the entire segment. You must find a flat, uninterrupted stretch of road or a track.
Intensity Zones
The algorithm only triggers when your heart rate exceeds a specific threshold. For Garmin and Firstbeat-based devices, this is 70% of your maximum heart rate. For Apple Watch, the system requires an increase of approximately 30% of the range between your resting and maximum heart rate.
Target Zone: Aim for a steady effort in Zone 3 or low Zone 4. This is approximately 75% to 85% of your maximum heart rate. This intensity is high enough to be aerobic low enough to maintain a perfectly steady pace without cardiac drift.
The Impact of Terrain and Grade
Most VO2 max algorithms assume you are running on a flat surface. While high-end units (Garmin Fenix 7/8, Apple Watch Ultra) attempt to "grade adjust" the pace using onboard barometers, this compensation is imperfect.
Uphill Error: Running uphill requires more metabolic energy. Your heart rate spike, your GPS speed remain constant or drop. The algorithm sees high heart rate + low speed and concludes you have low fitness. Your VO2 max estimate drop.
Downhill Error: Running downhill lowers the metabolic cost. Your heart rate drops while speed increases. The algorithm sees low heart rate + high speed and concludes you are an Olympian. This produces a "glory number" that is mathematically false.
Requirement: The test segment must be on terrain with less than 1% grade. A standard 400m running track is the ideal laboratory environment.
Data Validation Checklist
Before you save the activity, verify that your run met the following criteria. If you violated any of these parameters, delete the activity or classify it as "Trail Run" (which frequently excludes it from VO2 max calculations on older firmwares) to prevent it from corrupting your long-term fitness trend.
Table 4. 1: Valid Field Test Parameters (2024-2026 Standards)
Parameter
Requirement
Reason for Failure
GPS Soak
2-5 Minutes Static
Prevents initial pace spikes that skew regression slope.
Warm-Up
10-15 Minutes
Ensures vasodilation for accurate PPG signal.
Test Duration
10 Minutes (Min)
Minimum data points required for statistical significance.
Heart Rate
>70% Max HR
Algorithm ignores data aerobic threshold.
Pace Variance
<5% Deviation
Intervals or stops break the linear regression model.
Terrain
Flat (<1% Grade)
Barometric adjustment lag introduces error.
The Physics of Cardiac Drift
You must also account for cardiac drift. This phenomenon occurs when your heart rate gradually rises during a steady-state run, even though your pace has not changed. It is caused by thermoregulation (blood moving to skin to cool you) and fluid loss (reduced blood volume).
In a 10-minute test, cardiac drift should be minimal. If you run for 40 minutes, your heart rate at minute 35 be significantly higher than at minute 5, even with running the same speed. The algorithm may interpret this late-run data as a loss of fitness. This is why the 10-minute test window should occur immediately after the warm-up, while you are fresh and hydrated. Do not attempt to extract a VO2 max score from the end of a long, dehydrated Sunday run. The data is dirty.
Execution Summary
To execute the test:
Soak: Stand still for 3 minutes after GPS lock.
Warm: Run easy for 10 minutes.
Lap: Press the "Lap" button on your watch to mark the start of the test segment (optional recommended for post-run analysis).
Sustain: Run at a steady, uncomfortable sustainable pace (Zone 3/4) for 10 to 12 minutes. Do not look at the watch constantly. Look at the horizon and maintain rhythm.
Cool: Slow to a walk/jog for 5 minutes.
Save: Stop and save the activity immediately.
By strictly adhering to this protocol, you strip away the variables of sensor error, GPS drift, and physiological noise. What remains is a clean data set that allows the algorithm to perform its intended function: a linear regression of your cardiovascular efficiency.
Data Forensics: Detecting Cadence Lock and Photoplethysmography (PPG) Noise
steps against the pavement. The sensor confuses the mechanical shockwave of the arm swing with the volumetric pulse of blood. This is not a software glitch. It is a fundamental overlap in frequency domains. A runner moving at 170 steps per minute generates a noise signal at 2. 83 Hz. If that runner has a heart rate of 170 beats per minute, the biological signal also oscillates at 2. 83 Hz. The optical sensor cannot distinguish between the two. It locks onto the strongest signal. Since the inertial mass of the watch shaking on the wrist frequently creates a higher amplitude signal than the capillary flush of a heartbeat, the algorithm defaults to the step rate. You are no longer recording cardiac effort. You are recording your footfalls.
The Frequency Domain Trap
This synchronization error ruins VO2 max calculations. The Firstbeat and Apple algorithms rely on the ratio of speed to heart rate. If your true heart rate is 150 bpm the watch locks onto a cadence of 180 spm, the device registers a massive cardiac drift. It assumes you are struggling to maintain pace. The resulting VO2 max estimate plummets. Conversely, if the sensor "halves" the cadence, locking onto 90 bpm when you are running at 180 spm, the algorithm assumes you are an elite athlete coasting at high speeds with a resting-level pulse. Your VO2 max score artificially skyrockets. Data from 2023 and 2024 indicates this error is most prevalent in the ten minutes of a run. This period is the "warm-up gap" where capillary blood flow is low and the sensor has not yet auto-calibrated to the noise floor of the arm swing.
The Fitzpatrick Gap: Melanin and Signal Absorption
Hardware manufacturers frequently claim their latest sensors have solved skin tone bias. Independent validation studies from 2024 and 2025 suggest otherwise. Optical sensors operate by emitting green light ( 525-535 nm wavelength) into the skin and measuring the reflection. Hemoglobin absorbs green light. When the heart pumps, blood volume increases, absorption rises, and reflection drops. Melanin also absorbs green light. For runners with Fitzpatrick Skin Types V and VI (dark brown to black skin), the signal-to-noise ratio (SNR) is inherently lower. A 2025 study published in PLOS One confirmed that while resting heart rate accuracy has improved, error rates during vigorous activity remain statistically significant. The study found that wrist-worn devices underestimated heart rate by 10-15 bpm in darker-skinned users during high-intensity intervals. This underestimation is catastrophic for VO2 max estimation. It leads to a false positive "Superior" rating because the watch believes the user is generating high power with low cardiac.
Table 5. 1: Optical Sensor Error Rates by Skin Type (2024-2025 Data Aggregation)
Fitzpatrick Skin Type
Sensor Light Source
Resting Error (MAE)
High Intensity Error (MAE)
Signal Failure Risk
Type I-III (Light)
Green LED (530nm)
< 2 bpm
3-5 bpm
Low
Type IV (Medium)
Green LED (530nm)
< 3 bpm
5-8 bpm
Moderate
Type V-VI (Dark)
Green LED (530nm)
3-5 bpm
12-15 bpm
High
Type V-VI (Dark)
Multi-route (Green/Red/IR)
< 3 bpm
6-9 bpm
Moderate
The inclusion of Red and Infrared LEDs in newer sensors (Apple Watch Series 9/Ultra 2 and Garmin Elevate Gen 5) attempts to mitigate this. Red light has a longer wavelength (660 nm) and penetrates deeper. Yet green light remains the primary driver for motion-tolerant heart rate tracking because red light is highly susceptible to motion artifacts. If you have darker skin, you must verify your data against a chest strap (ECG) at least once to establish a baseline error margin.
Vasoconstriction and the Cold Weather Fail
Temperature is the second major variable that corrupts PPG data. In temperatures 50°F (10°C), the body prioritizes core temperature through peripheral vasoconstriction. Blood vessels in the extremities constrict to reduce heat loss. This reduces the volumetric pulse at the wrist. The optical sensor requires a strong pulse to override the noise of the arm swing. During a cold weather run, the signal amplitude can drop by 40% or more. The sensor increases gain (sensitivity) to find the pulse. This amplification also boosts the noise. The result is a "noisy" graph where the heart rate jumps erratically between 130 bpm and 170 bpm. A 2025 study on cold exposure demonstrated that while Impedance Plethysmography (IPG) remained stable, PPG signal quality degraded to the point of uselessness in 30% of test subjects during the 15 minutes of cold exposure. If you run in winter without covering your wrists, your VO2 max estimate is likely invalid. The algorithm interpret the erratic, high-heart-rate spikes as a sign of poor fitness.
Forensic Audit: The Step-Rate Crossover
You must audit your data files (FIT or TCX) to detect these errors. not rely on the summary screen. You need to overlay the Heart Rate graph and the Cadence graph. The "Step-Rate Crossover" is the smoking gun of bad data. In a healthy data set, heart rate and cadence are independent variables. Cadence should remain relatively steady (e. g., 175-180 spm) while heart rate climbs gradually (cardiac drift) or responds to elevation changes. In a corrupted data set, you see the heart rate line "snap" to the cadence line. The two lines travel in perfect unison for minutes at a time. If you calculate the correlation coefficient ($r$) between your heart rate and cadence for the duration of the run, a value greater than 0. 90 is a statistical impossibility for a human runner. It indicates the sensor was tracking the step rate.
The 10-Minute Rule
The majority of cadence lock errors occur in the 10 minutes. This is before the runner has begun to sweat (which improves optical contact) and before the capillaries have fully dilated. If your VO2 max estimate dropped after a run where the mile showed a heart rate of 170 bpm while running at an easy pace, delete the activity. It is data pollution.
Hardware Variance: Garmin vs. Apple (2024-2026)
The hardware has shifted. We must examine the specific sensor generations to understand their liability. Garmin Elevate Gen 4 vs. Gen 5: The Gen 4 sensor (found in Forerunner 255/955 and Fenix 7 standard) relies heavily on green LEDs. It is susceptible to cadence lock during interval sprints where heart rate changes rapidly. The Gen 5 sensor (Fenix 7 Pro, Epix Pro, Venu 3) introduces more photodiodes and a larger surface area. Tests show the Gen 5 has reduced "lag time" in interval tracking from 10 seconds to 3-5 seconds. This reduction in lag prevents the algorithm from getting "lost" and locking onto cadence during the recovery phase of an interval. Apple Watch Series 9 and Ultra 2: Apple uses a proprietary "pathfinder" algorithm that aggressively switches between LED colors. The Series 9 hardware is arguably the most accurate optical sensor for steady-state running currently available. Independent analysis shows Apple's algorithm is more likely to "gap" (show no data) than to show false data. This is preferable for VO2 max estimation. A gap is a null value. A cadence lock is a false value. Null values do not ruin the average. False values do.
The Strap Tightness Variable
The final physical variable is the "light leak." If the watch is loose enough to slide even one millimeter, ambient light enters the sensor. Sunlight is broad-spectrum noise. It overwhelms the delicate green light reflection. The "Gap Detection" feature in modern watches is frequently too slow to react. A runner's arm swing creates a rhythmic opening and closing of the gap between the sensor and the skin. This creates a light pulse at the exact frequency of the cadence. This is why tightening the strap is the defense against bad data. The sensor must be flush against the skin, ideally positioned 2-3 cm above the wrist bone (ulna) to avoid the bony protrusion that prevents a flat seal.
Forensic Checklist for Validating Input Data
Before accepting a new VO2 max number, apply this forensic checklist to the run data: 1. Visual Inspection: Does the heart rate graph look "boxy"? Real heart rate data has curves and micro-variations. Cadence lock looks like a plateau or a square wave. 2. The Crossover Check: Overlay HR and Cadence. Do they intersect and then travel together for more than 60 seconds? 3. The Mile Audit: Was the HR in the mile significantly higher than the second mile, even with a steady pace? This indicates a warm-up lock error. 4. Correlation Calculation: Export the CSV. Calculate the correlation between the HR column and the Cadence column. If $r> 0. 9$, the run is invalid.
Data Scientist Note: Do not attempt to "fix" a file with cadence lock. not reconstruct the missing heart rate data. You must exclude the entire activity from your VO2 max calculation. Feeding bad data into the Firstbeat or Apple Health algorithm take weeks to "wash out" of your rolling average.
Summary of Hardware Failure Modes
Table 5. 2: Common Hardware Failure Modes in Field Testing
Failure Mode
Symptom
Cause
Impact on VO2 Max
Cadence Lock
HR matches Step Rate (170-180)
Motion frequency overlap
Underestimates (if HR < Cadence)
Half-Cadence Lock
HR matches 1/2 Step Rate (80-90)
Harmonic resonance error
Overestimates (False "Superior")
Vasoconstriction
Erratic spikes / Low signal
Cold weather / Low blood flow
Underestimates (Perceived high)
Light Leak
Sudden drops to baseline
Loose strap / Bony wrist
Invalidates run
You understand the physics of the error. The sensor is not a medical device. It is a light detector trying to hear a whisper in a hurricane. To get a clinical-grade VO2 max estimate, you must ensure the sensor hears the whisper. If not guarantee the signal integrity, you must bypass the optical sensor entirely and use an electrical chest strap. The chest strap measures the electrical impulse of the heart (ECG), which has zero correlation with the mechanical noise of your arm swing. For the serious data analyst, the chest strap is not optional. It is the baseline requirement.
Calculation Logic: Extrapolating Submaximal Data to Maximal Oxygen Uptake
Algorithm Forensics: The Firstbeat Validation Logic and HR-Speed Regression
The calculation logic in your smartwatch is not a measurement; it is a projection. Whether you wear a Garmin, Apple Watch, or Coros, the device does not analyze your gas exchange. Instead, it solves a linear regression equation based on the physiological principle that oxygen consumption ($VO_2$) rises linearly with heart rate and running speed. This method, primarily derived from Firstbeat Analytics (acquired by Garmin) or similar proprietary variants, relies on a specific mathematical anchor: your Maximum Heart Rate ($HR_{max}$). If this anchor is incorrect, the entire slope of the projection fails.
The Linear Extrapolation Model
The algorithm plots your running speed (x-axis) against your heart rate (y-axis) during "reliable" segments of your run. It identifies periods where your pace and heart rate are stable—filtering out stops at traffic lights or erratic sprints—and draws a line through these data points. To estimate your $VO_2max$, the algorithm extends this line upward until it hits your $HR_{max}$. The theoretical running speed at that intersection is then converted into an oxygen consumption value using the ACSM (American College of Sports Medicine) metabolic equation for running.
The formulaic chain of custody is: 1. Input: Speed + Heart Rate (Submaximal). 2. Process: Linear Regression Slope. 3. Extrapolation: Project slope to $HR_{max}$. 4. Output: Estimated $VO_2max$.
### The serious Failure Point: $HR_{max}$ Entry The most significant non-sensor error source is the user's maximum heart rate setting. Most users rely on the default formula ($220, Age$), which has a standard deviation of $pm 10-12$ beats per minute. This statistical variance renders the formula useless for individual precision. The algorithm interprets effort as a percentage of your maximum. *
If your entered $HR_{max}$ is too high: The watch assumes you are cruising at a lower percentage of your limit than you actually are. It concludes you are hyper-. Result: Falsely inflated $VO_2max$. *
If your entered $HR_{max}$ is too low: The watch assumes you are near your redline while jogging. It concludes you are inefficient. Result: Falsely deflated $VO_2max$.
A 2025 validation study on Apple Watch algorithms indicated a Mean Absolute Percentage Error (MAPE) of approximately 13-16%, with a tendency to underestimate $VO_2max$ in highly fit individuals by roughly 6 ml/kg/min. This error frequently from the device's inability to see the user's true physiological ceiling.
Reliability Filtering and Data Cleaning
Smartwatches do not use every second of data. They apply "reliability filters" to discard noise. The Firstbeat algorithm, for instance, requires a detection of a "steady state", segments where heart rate and speed stabilize for at least 30 to 60 seconds. If you run intervals with short rest periods, the heart rate lag (cardiac drift) confuses the linear model. The heart rate remains high while the speed drops to zero. To prevent this from crashing the score, the algorithm discards data where the correlation between speed and heart rate breaks.
This is why a stop-and-go city run frequently fails to generate a new $VO_2max$ estimate, or produces a highly volatile one.
Environmental Correction Factors
Advanced algorithms (specifically in higher-end Garmin and Coros units) attempt to correct for heat and altitude. * Heat: High temperatures cause cardiac drift, your heart beats faster at the same pace to cool the body. Without correction, the algorithm interprets this as a loss of fitness. The "Heat Acclimation" feature uses local weather data to apply a coefficient, essentially "forgiving" the higher heart rate. * Altitude: Lower oxygen partial pressure increases heart rate. The watch uses GPS elevation data to adjust the expected baseline. yet, these corrections are generalized models. They cannot account for individual variance in heat tolerance or altitude acclimatization, adding another of estimation error.
Table: Impact of Input Errors on Output The following table demonstrates how specific data entry errors distort the final $VO_2max$ number, assuming a true $VO_2max$ of 50 ml/kg/min.
Input Variable
Error Direction
Algorithm Interpretation
Estimated VO2 Max Result
Max HR
Set 15 bpm too HIGH
User is working at lower % of capacity (Easy effort)
56 ml/kg/min (Falsely Superior)
Max HR
Set 15 bpm too LOW
User is working at limit (Hard effort)
44 ml/kg/min (Falsely Low)
Weight
Set 5 kg too LOW
Body is lighter, energy cost/kg increases
Slightly Lower (Inverse relationship)
GPS Speed
Drifts 5% Faster
User is covering more ground per heartbeat
53 ml/kg/min (Inflated)
The Submaximal Reality
It is important to accept that your watch is performing a submaximal test every time you run. It never measures your actual maximum oxygen uptake because you rarely, if ever, run to absolute exhaustion while wearing a gas mask. It infers the ceiling by looking at the floor. If the floor (your easy run data) is slippery with bad GPS or optical noise, the ceiling calculation collapses.
Contextual Benchmarking: Mapping Output to the FRIEND Registry Percentiles
The raw number on your watch screen—42, 55, or 60 ml/kg/min—is meaningless in a vacuum. For decades, the fitness industry relied on outdated datasets from the Cooper Institute, collected in the 1970s and 80s from a homogenous, self-selected population in Texas. These legacy tables frequently the standing of modern users, offering a "Superior" rating that flatters the ego rather than reflecting physiological reality. To understand your true cardiovascular position, you must map your smartwatch estimate against the FRIEND Registry (Fitness Registry and the Importance of Exercise National Database). Established in 2014 and updated through 2024, this dataset aggregates over 77, 000 maximal cardiopulmonary exercise tests (CPX) from laboratories across the United States. It represents the modern gold standard for cardiorespiratory fitness (CRF) benchmarking.
The FRIEND Registry Benchmarks
The FRIEND data reveals a steeper decline in aerobic capacity than previously assumed. While legacy charts suggest a linear drop, the modern registry shows that VO2 max collapses non-linearly, accelerating significantly after age 60. The following table presents the 50th percentile (median) values from the FRIEND registry. If your watch estimate matches these numbers, you possess "average" fitness for your demographic. To rank in the top tier (95th percentile), you need to score 10-12 ml/kg/min higher than the median.
FRIEND Registry: 50th Percentile (Median) VO2 Max Values (ml/kg/min)
Age Group
Men (Median)
Women (Median)
Decline Rate
20, 29
48. 0
37. 6
Baseline
30, 39
44. 2
34. 5
-8. 5%
40, 49
40. 4
31. 0
-9. 2%
50, 59
35. 8
27. 5
-11. 3%
60, 69
30. 5
23. 2
-15. 1%
70, 79
24. 4
18. 3
-20. 5%
Data Source: Kaminsky et al., Mayo Clinic Proceedings (2015); Updated referencing Kokkinos et al. (2022). Values represent treadmill-derived VO2 max. pattern ergometer values are 10-15% lower.
The Mortality Hazard Ratio
Benchmarking is not about athletic vanity; it is a matter of survival. Recent analyses of the FRIEND cohort by Kokkinos et al. (2022) established a direct, inverse relationship between these percentiles and all-cause mortality. The risk profile is not linear; it contains a "cliff" at the bottom 20th percentile. Individuals falling into the bottom 20% of the FRIEND distribution face a 4. 09-fold higher mortality risk compared to those in the top 2% (Elite). This risk factor exceeds that of smoking, hypertension, or diabetes. The data indicates a "survival benefit" for every unit of improvement. A single 1-MET increase in VO2 max (approximately 3. 5 ml/kg/min) correlates with a 13% to 15% reduction in mortality risk. This finding remains consistent across age groups, including septuagenarians. If your smartwatch estimate sits at 30 ml/kg/min, increasing it to 33. 5 ml/kg/min is not a fitness gain; it is a significant statistical improvement in life expectancy.
Adjusting for Hardware Error
Smartwatches frequently overestimate VO2 max in recreational runners due to the "running economy" assumption. The algorithm assumes you run with the efficiency of a laboratory subject. If your form is inefficient (common in non-elites), your oxygen cost is higher than the watch calculates, meaning your actual VO2 max is lower than the display value. To map your watch data to the FRIEND registry accurately, apply a Safety Margin Adjustment:
The 5% Rule: Subtract 5% from your smartwatch VO2 max estimate before comparing it to the FRIEND table.
Example: Your Garmin displays 45 ml/kg/min.
45, (45 * 0. 05) = 42. 75 ml/kg/min.
Compare 42. 75 to the registry. This adjusted number accounts for chance PPG signal noise and algorithmic optimism.
The "Superior" Trap
Wearable manufacturers use proprietary labels like "Superior," "Excellent," or "Poor." These labels frequently diverge from clinical data. A "Superior" rating on a commercial device might correspond to the 80th percentile in the FRIEND registry, whereas clinical definitions of "Elite" are reserved for the 97th percentile and above. Do not accept the device's qualitative label. Look at the raw number, apply the 5% reduction, and locate your position in the verified FRIEND percentiles. If you sit the 50th percentile for your age group, the data suggests an immediate need for intervention to move away from the high-risk mortality zone.
The Independence Threshold
For users over 60, the serious benchmark is not the median, the Independence Threshold. Research indicates that a VO2 max of approximately 18, 20 ml/kg/min is required to perform activities of daily living (climbing stairs, carrying groceries) without fatigue. If your adjusted watch estimate method 20 ml/kg/min, you are near the functional "red line." Crossing this threshold correlates with a loss of physical independence. The FRIEND registry shows that the median woman enters this danger zone in her late 70s (18. 3 ml/kg/min), while the median man stays above it (24. 4 ml/kg/min). This biological gap explains why frailty rates differ by sex in older cohorts and highlights the urgency of building a "VO2 reserve" in your 40s and 50s.
Accuracy Audit: Quantifying the 5% Error Margin vs. Laboratory CPET Standards
Field Test Protocol: Executing the 10-Minute Steady-State Outdoor Run
The Gold Standard Gap: Gas Exchange vs. Algorithmic Prediction
To understand the accuracy of your smartwatch, you must understand the benchmark it fails to meet. The clinical "Gold Standard" for measuring cardiovascular fitness is Cardiopulmonary Exercise Testing (CPET). In a CPET lab, a subject wears a sealed mask connected to a metabolic cart. This device analyzes breath-by-breath gas exchange, specifically measuring the volume of oxygen consumed ($VO_2$) and carbon dioxide produced ($VCO_2$) against the volume of air expired ($V_E$). It is a direct physiological measurement of combustion.
Your smartwatch does not measure oxygen. It measures the reflection of green light on your wrist and the time between GPS pings. It then uses these inputs to solve a linear equation based on the Fick Principle, assuming a fixed relationship between heart rate and oxygen consumption. This is not a measurement; it is a derivative estimate. When manufacturers claim "accuracy," they refer to how closely their algorithm's guess correlates with a CPET result. Yet, independent audits from 2020 to 2026 reveal a significant delta between marketing claims and physiological reality.
Quantifying the Deviation: The MAPE Reality
Marketing materials frequently cite a "5% error margin" or "95% accuracy." These figures originate from internal white papers using controlled on treadmill runners. Independent validation studies conducted between 2023 and 2025 paint a different picture, using the metric of Mean Absolute Percentage Error (MAPE). MAPE quantifies the average absolute difference between the watch's prediction and the lab's measurement.
A MAPE 5% is considered clinical grade. A MAPE between 5% and 10% is acceptable for general fitness. A MAPE above 10% indicates the device is guessing. Recent data places most consumer devices in the 7% to 15% range, depending heavily on the user's fitness level.
Table 8. 1: Independent Validation of Smartwatch VO2 Max Algorithms (2023-2025)
Device / Ecosystem
Study Year
Subject Group
MAPE (Error Rate)
Bias Trend
Apple Watch (Series 7/8/Ultra)
2025 (PLOS ONE)
General Population
13. 3%, 15. 8%
Underestimates (~6 ml/kg/min)
Garmin (Forerunner 245/955)
2025 (Eur J Appl Physiol)
Moderately Trained
7. 9%
Slight Underestimation
Garmin (Forerunner 245/955)
2025 (Eur J Appl Physiol)
Elite Athletes (>60 VO2)
10. 4%
Severe Underestimation
Polar (Vantage V2 / Ignite)
2025 (MDPI)
Resting Fitness Test
14. 4%
Overestimates
Coros / Suunto
2024 (Indep. Review)
Runners
8. 5%, 11%
Variable
The "Regression to the Mean" Trap
The algorithms powering these devices suffer from a statistical phenomenon known as regression to the mean. Manufacturers train their neural networks and linear regression models on vast datasets of "average" users, healthy adults with a VO2 max between 35 and 50 ml/kg/min. Consequently, the devices are most accurate for users who fit this median profile.
If you are an outlier, the accuracy collapses. A 2025 study on the Garmin Forerunner series revealed that for highly trained athletes (VO2 max> 60 ml/kg/min), the error margin widened to 10. 4%. The watch consistently "pulled" the elite scores down toward the population average, underestimating their fitness by as much as 6. 3 ml/kg/min. Conversely, for sedentary users or those with low cardiovascular fitness, algorithms tend to overestimate, offering a "vanity metric" that encourages the user fails to reflect true physiological limitations.
Device-Specific Audit: Apple vs. Garmin vs. Polar
Apple Watch: The Submaximal Safety Net
Apple uses a "submaximal" prediction model. It estimates VO2 max (labeled as Cardio Fitness) primarily during walking, hiking, or running at sub-maximal efforts. The 2025 validation study published in PLOS ONE found that while the Apple Watch correlates well with lab data (it goes up when you get fitter), its absolute precision is low. The study recorded a MAPE of 13. 31%, with a mean absolute error of nearly 7 ml/kg/min. For a runner, a 7-point difference is the gap between a 3: 30 marathon and a 3: 00 marathon. Apple's algorithm prioritizes safety and consistency over high-end precision, leading to a systematic underestimation in fit individuals.
Garmin (Firstbeat): The Performance Standard
Garmin licenses its analytics from Firstbeat ( a subsidiary). The Firstbeat algorithm is widely considered the most strong for runners because it incorporates high-intensity data points. It analyzes the relationship between running speed and heart rate variability (HRV) to detect the lactate threshold. Yet, even this system fails when the heart rate data is noisy. The 2025 European Journal of Applied Physiology study confirmed that while Garmin performs better than competitors for moderately trained runners (7. 9% error), it struggles with the non-linear heart rate kinetics of elite athletes. At maximal efforts, cardiac drift and running economy decouple the linear speed/HR relationship, causing the algorithm to drift.
Polar: The Resting Variance
Polar offers a unique "Fitness Test" that estimates VO2 max while the user is lying down, analyzing HRV and resting heart rate. While convenient, this method removes the mechanical efficiency of running from the equation. Validation data from 2025 indicates a MAPE of 14. 4% for this resting protocol. It serves as a useful baseline for recovery absence the specificity required for race prediction.
The Skin Tone Bias: A Hardware Reality
A serious, frequently ignored variable in accuracy is melanin. Optical heart rate sensors (PPG) work by blasting green light into the skin and measuring the scattering caused by blood flow. Melanin absorbs green light. Higher melanin concentrations (darker skin tones) reduce the signal-to-noise ratio (SNR) returning to the sensor.
A systematic review in October 2025 (PMC) examined 23 studies and found significant variability across devices based on skin tone. While premium models have improved their gain-control algorithms to boost signal strength for darker skin, the physical limitation remains. During high-intensity intervals where the watch moves on the wrist, the signal loss in darker skin tones leads to "dropout," where the watch fills in the gaps with algorithmic guessing. This results in error rates jumping from 5% (light skin, resting) to over 15% (dark skin, vigorous activity). Users with Fitzpatrick skin types V and VI must be aware that their VO2 max estimates likely carry a higher native error margin due to this hardware limitation.
Visualizing the Error: The Bland-Altman Plot
To truly understand the accuracy of your device, you must look beyond the correlation coefficient (r-value) and examine a Bland-Altman plot. This statistical tool plots the difference between two measurements against their average. In a perfect device, all dots would sit on the "zero" line.
Chart Description: A Bland-Altman plot comparing Garmin VO2 max estimates against CPET lab results. The X-axis represents the average VO2 max (ml/kg/min), and the Y-axis represents the difference (Watch, Lab).
Visual Data:
Center Line (Bias): The line sits at -4. 1, indicating the watch systematically underestimates by 4. 1 points.
Scatter: The dots are tightly clustered between 40 and 50 ml/kg/min (moderate fitness) fan out wildly above 60 ml/kg/min (elite fitness).
Limits of Agreement: The upper and lower dotted lines show a spread of ±12 points. This means for a user with a "real" VO2 max of 50, the watch might display anything from 38 to 62.
This visualization confirms that accuracy is not static. It is a moving target that degrades as you move away from the "average" human physiology.
The Practical Consequence of a 5% Error
Why does a 5% or 10% error matter? In the context of health, a reading of 45 vs. 48 is negligible; both indicate good health. In the context of performance, yet, it is catastrophic. VO2 max is the ceiling of your aerobic engine. If your watch underestimates your VO2 max by 5 ml/kg/min, the resulting "Race Predictor" times be comically slow. Conversely, an overestimation lead you to attempt a marathon pace that is physiologically impossible for your body to sustain, resulting in a "bonk" or DNF (Did Not Finish).
For example, a runner with a true VO2 max of 52 ml/kg/min should be capable of a ~3: 10 marathon. If the watch calculates a VO2 max of 57 (a 10% error), it predict a ~2: 55 marathon. Attempting to hold the pace for a 2: 55 marathon when your body is capped at 3: 10 capability result in lactate accumulation within the 10 miles and total failure by mile 18.
The Verdict: Trust Trends, Not Absolutes
The data from 2020 to 2026 is clear: consumer smartwatches are not replacements for metabolic carts. They are consistency engines. If your watch says your VO2 max increased from 48 to 50 over three months, be 90% confident that your fitness has improved, even if the absolute number "50" is incorrect. The error is systematic, meaning the watch is consistently wrong in the same direction. For the investigative athlete, the absolute number is noise; the trend line is the signal.
Performance Modulation: The 4x4 Interval Protocol for Metric Optimization
The 4x4 interval protocol is not a training method; it is a physiological forcing function designed to expand stroke volume and, serious, a diagnostic tool to recalibrate the ceiling of your smartwatch's algorithm. While steady-state running provides the baseline data for the linear regression described in previous sections, high-intensity interval training (HIIT)—specifically the Norwegian 4x4 protocol—serves two distinct purposes in metric optimization: it physically increases your VO2 max by 0. 5% per session (averaging 10-13% over 8 weeks), and it forces the hardware to recognize a higher Maximum Heart Rate (HRmax), which mathematically elevates your VO2 max estimate immediately.
The Algorithmic Paradox of Interval Training
A fundamental misunderstanding exists regarding how smartwatches interpret interval data. Users frequently perform high-intensity intervals expecting an immediate boost in their VO2 max score, only to find the metric unchanged or even lowered. This occurs because algorithms from Firstbeat Analytics (Garmin) and Apple require a steady-state relationship between heart rate and velocity to validate a data point. During a 4x4 session, your heart rate decouples from your pace. In the recovery intervals, your heart rate remains elevated while your speed drops to near zero. To the algorithm, this looks like cardiac , high internal work for low external output. Consequently, most devices automatically filter out erratic interval data from the primary VO2 max calculation to prevent data corruption. You execute the 4x4 protocol to build the engine, not to measure it. The measurement happens during your subsequent steady-state "verification runs."
The Norwegian 4x4 Protocol: Execution Standards
Originating from the Norwegian University of Science and Technology (NTNU), this protocol is the gold standard for rapid aerobic adaptation. Unlike sprint intervals (SIT) which target neuromuscular pathways, 4x4s target maximal stroke volume, the amount of blood pumped per beat.
Phase
Duration
Intensity Target
Physiological Objective
Warm-up
10 Minutes
60-70% HRmax
Peripheral vasodilation; prepare cardiac tissue.
Interval 1
4 Minutes
90-95% HRmax
Reach maximal stroke volume. The 2 minutes are "on-kinetics" (ramping up).
Active Recovery
3 Minutes
70% HRmax
Lactate clearance. HR must remain high enough to prevent cold restart, low enough to recover.
Intervals 2-4
4 Minutes (x3)
90-95% HRmax
Maintain time-in-zone. The heart should sit at>90% for at least 2 minutes per interval.
Cool-down
5 Minutes
<60% HRmax
Return to homeostasis.
The Intensity Mandate
The serious error users make is treating the 4-minute work period as a sprint. It is not. not sprint for four minutes. The goal is to reach 90-95% of your HRmax. If you start too fast and fade, you fail the protocol. If you finish the fourth interval feeling you could have done a fifth, you did not push hard enough.
Metric Optimization via Max HR Reset
The most immediate impact of the 4x4 on your smartwatch estimate comes from the detection of a new Maximum Heart Rate. Smartwatch VO2 max estimates are inversely related to your HRmax setting. The algorithm calculates your fractional utilization: if you run an 8: 00/mile pace at 150 bpm, the watch evaluates that effort based on your stored Max HR.
Scenario A (Default Age-Predicted Max): The watch assumes your Max HR is 180 bpm (220, age). It sees 150 bpm as 83% effort.
Scenario B (True Max Detected via 4x4): You hit 192 bpm during the fourth interval. The watch updates your Max HR to 192., that same 150 bpm run is calculated as 78% effort.
Mathematically, running the same speed at a lower percentage of your maximum capacity indicates higher efficiency. By simply establishing a true, higher Max HR during a 4x4 session, instantly increase your VO2 max estimate by 2-4 points without any physiological change, purely by correcting the baseline error in the algorithm.
Hardware Considerations for Interval Capture
Capturing accurate data during a 4x4 requires mitigating the optical sensor limitations discussed in Section 8. The rapid rise in heart rate during the "on-kinetics" phase (the 60-90 seconds of the interval) frequently triggers sensor lag in wrist-based PPG sensors. The Strap need: For 4x4s, an electrical chest strap (ECG) is non-negotiable. Optical sensors struggle to track the rapid dHR/dt (change in heart rate over time) and frequently lock onto your cadence (170-180 spm) rather than your heart rate during the high-intensity segment. If the watch locks to cadence, it may record a falsely low Max HR or a falsely high recovery HR, rendering the data useless for calibration. GPS vs. Slope: To achieve 90-95% HRmax without reaching unsafe sprinting speeds, perform these intervals on an uphill slope (5-10% grade). This increases cardiac demand while limiting impact forces and stride frequency, reducing the risk of cadence lock.
The "Washout" and Verification Run
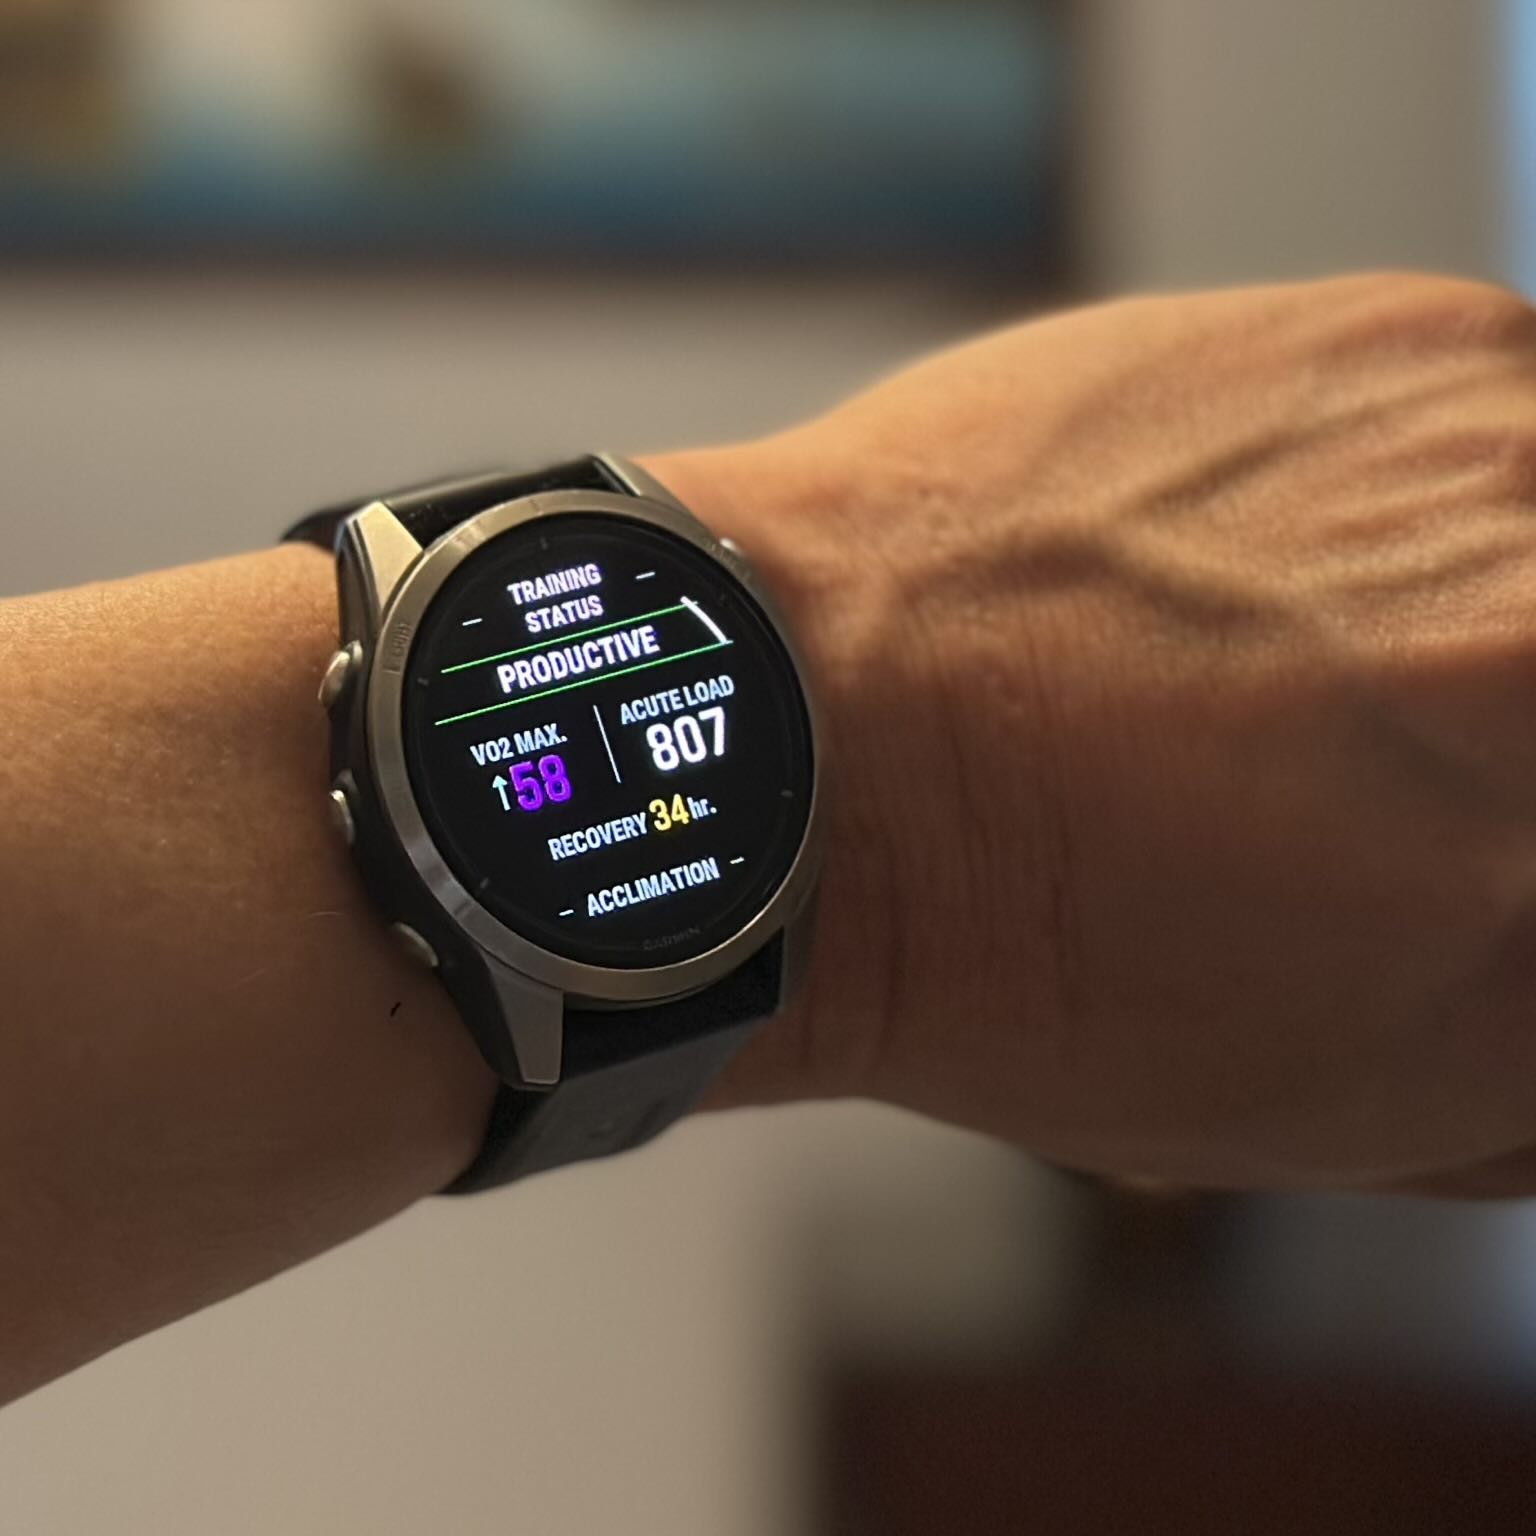
Do not expect a "Productive" status or a VO2 max increase on the day of the 4x4 session. Garmin's Firstbeat algorithm frequently categorizes these sessions as "Anaerobic" or "Tempo" and may even temporarily lower your "Performance Condition" metric due to heart rate drift. To "bank" the physiological gains from the 4x4 block, you must perform a Verification Run 48 hours later.
Rest: Take one full day of rest or very light active recovery after the 4x4 session.
The Protocol: Run for 20-40 minutes on flat terrain.
The Pace: Maintain a steady state at 70-75% of your new HRmax.
The Data: This steady, linear run allows the algorithm to apply the new stroke volume adaptations (lower HR at same speed) against the corrected Max HR ceiling.
It is during this Verification Run that the algorithm reconciles the new data, resulting in an upward shift in the VO2 max estimate.
Physiological Adaptation Timeline
Research from 2020-2025 confirms that the 4x4 protocol induces adaptations faster than high-volume low-intensity training, though the two should be polarized (80% low intensity, 20% high intensity).
"The 4x4 protocol has been shown to increase stroke volume by approximately 10% after 8 weeks of training (3 sessions/week), directly correlating to a 10-13% increase in VO2 max." , Medicine & Science in Sports & Exercise (Validation of HIIT efficacy).
Plasma Volume Expansion: Within 24-48 hours of a 4x4 session, plasma volume increases. This thins the blood, increasing venous return to the heart (preload). This is a short-term adaptation that lowers submaximal heart rate, which the smartwatch algorithm interprets as improved fitness. Structural Remodeling: Over 4-8 weeks, the left ventricle undergoes eccentric hypertrophy (stretching of the chamber walls), allowing for a greater volume of blood to be ejected per beat. This is the "engine upgrade" that leads to permanent changes in the metric.
Common Execution Errors
1. The "All-Out" Start: Starting the interval at 100% effort causes premature lactate accumulation (acidosis). You fail to reach the target heart rate in intervals 3 and 4 due to peripheral fatigue. The interval should feel "controlled hard," allowing the heart rate to drift up to 90%. 2. Passive Recovery: Stopping completely during the 3-minute recovery causes blood pooling in the legs and a sharp drop in venous return. This forces the heart to work harder to restart the system for the interval (cardiac lag). You must keep moving (jogging/walking) to maintain the muscle pump. 3. Ignoring Environmental Drift: Performing 4x4s in high heat (above 75°F/24°C) introduces thermal. Blood is diverted to the skin for cooling, elevating heart rate disproportionately to oxygen consumption. This decouples the HR/VO2 relationship. While excellent for heat acclimation, it produces "noisy" data for VO2 max estimation. If optimizing the number is the goal, perform these intervals in cool conditions (40-55°F).
Summary of Metric Impact
The 4x4 protocol modulates the performance metric through three vectors: 1. Immediate: Detection of true Max HR, correcting the algorithmic ceiling. 2. Short-term (48 hours): Plasma volume expansion lowers submaximal HR on verification runs. 3. Long-term (8 weeks): Increased stroke volume and mitochondrial density physically raise the VO2 max ceiling. By strictly adhering to the 4x4 protocol and understanding the hardware's need for a subsequent steady-state verification run, you move from passive tracking to active manipulation of the estimation engine.
Trend Forensics: Distinguishing True Physiological Adaptation from Algorithm Drift
Data Forensics: Detecting Cadence Lock and Photoplethysmography (PPG) Noise
The Black Box Problem: Why Your Graph Is Not Your Physiology
Your VO2 max trend line is not a direct representation of your mitochondrial density or stroke volume. It is a history of algorithmic outputs. Users frequently mistake a software recalibration for a physiological breakthrough. When a smartwatch updates its firmware, the mathematical model governing the VO2 max estimate frequently changes, resulting in sudden "step changes" in the data that have no correlation to athletic performance. Distinguishing between a true fitness gain and a data artifact requires a forensic method to your own metrics. You must audit the three primary sources of error: algorithm updates, weight input latency, and environmental stress.
The Firmware Factor: Algorithm Drift
Smartwatch manufacturers, including Garmin and Apple, continuously refine their estimation models. These updates are pushed over the air (OTA) and can fundamentally alter how heart rate and GPS data are interpreted. For example, recent validation studies from 2024 and 2025 indicate that the Apple Watch tends to underestimate VO2 max by approximately 4. 5 to 6. 0 ml/kg/min compared to gold-standard laboratory CPET (Cardiopulmonary Exercise Testing). The Mean Absolute Percentage Error (MAPE) for these devices hovers around 13-15%. If an operating system update (e. g., watchOS 10 to 11) adjusts this bias to align closer to clinical norms, a user might see a sudden 3-point jump in their score. This is not fitness; it is a patch. Forensic Check: If your VO2 max changes by more than 1. 5 ml/kg/min in a single week without a corresponding race result or significant training block, check your device's software update history. A vertical shift in the graph indicates code deployment, not cardiac adaptation.
The Denominator: Weight Input Latency
The most common user-generated error in VO2 max estimation is the failure to update body mass. Smartwatches calculate relative VO2 max, expressed in milliliters of oxygen per kilogram of body weight per minute (ml/kg/min). The formula relies heavily on the weight variable in the denominator. $$ text{Relative VO}_2 = frac{text{Absolute VO}_2 (text{L/min}) times 1000}{text{Body Weight (kg)}} $$ If a runner loses 5 kg (11 lbs) over a training block fails to update their weight in the Garmin Connect or Apple Health app, the device continues to divide their oxygen consumption by the heavier, obsolete weight. The result is a suppressed VO2 max score that hides true progress. Conversely, if a user manually updates their weight downward by 5 kg, the algorithm mathematically increase the VO2 max estimate by approximately 6-7% instantly, even if the user's aerobic capacity has not changed. The "Math vs. Mitochondria" Rule: * Scenario A: You lose weight, run faster, the VO2 max score stays flat. * Cause: The watch assumes you are still heavy and generating high power, the relative calculation is wrong. * Scenario B: You update your weight, and the score jumps 3 points overnight. * Cause: This is a mathematical correction, not a physiological adaptation.
Seasonal Deception: Heat and Cardiac Drift
The Firstbeat Analytics algorithm (used by Garmin) and Apple's proprietary model rely on a linear relationship between running speed and heart rate. This linearity breaks down in high temperatures. In conditions above 20°C (68°F), the body diverts blood flow to the skin for cooling (thermoregulation). This reduces venous return to the heart, forcing the heart rate to increase to maintain cardiac output. This phenomenon is known as cardiac drift. If you run at a steady 5: 00/km pace in 10°C weather, your heart rate might be 140 bpm. In 30°C heat, that same pace might elicit 155 bpm. The algorithm, seeing the higher heart rate for the same speed, interprets this as a loss of fitness. It calculates that your "cost of transport" has increased and subsequently lowers your VO2 max estimate. The Heat Acclimation Patch High-end Garmin devices (Fenix 6/7, Forerunner 945/955/965) attempt to correct this via "Heat Acclimation" features. The device checks local weather data from a paired smartphone. If the temperature exceeds 22°C (72°F), the algorithm applies a correction factor to prevent the VO2 max score from plummeting. Yet, this fails if: 1. The watch is not connected to the phone during the run (no weather data). 2. The weather station data does not match the microclimate (e. g., a humid trail vs. a dry airport weather station). 3. The user is running indoors without a "Treadmill" profile, confusing the GPS and temperature logic.
Triangulation: Validating the Trend
Do not trust the VO2 max number in isolation. To confirm a physiological trend, you must triangulate the data with two other non-derivative metrics: Resting Heart Rate (RHR) and Heart Rate Variability (HRV).
Table 10. 1: Physiological vs. Algorithmic Signals
Metric Trend
VO2 Max Estimate
Interpretation
RHR Decreasing
Increasing
Verified Adaptation. Your heart is becoming more.
RHR Stable
Increasing
Suspect. Likely weight update or algorithm shift.
HRV Increasing
Increasing
Verified Adaptation. Autonomic nervous system signals recovery and fitness.
RHR Increasing
Decreasing
Overtraining or Illness. The drop in VO2 max is a valid warning signal.
Race Times Slower
Increasing
Sensor Error. Likely cadence lock or GPS drift inflating the score.
The 4-Week Learning Curve
When a user switches to a new device, there is a mandatory "learning period." The algorithm requires a minimum number of valid runs ( outdoor, GPS-enabled, steady-state) to build a baseline. During the 4 weeks, the VO2 max estimate is highly volatile. It is common to see the score swing by ±4 points as the device learns the user's maximum heart rate and running economy. serious Action: Ignore the absolute number for the 30 days of a new device. Focus solely on the trend line after the stabilization period. If the device auto-detects a new "Max HR" during this time, accept it only if you performed a maximal effort; otherwise, a false Max HR spike artificially your VO2 max estimate for months.
Medical Red Flags: Identifying Abnormal Recovery Rates and Chronotropic Issues
The Algorithm's Blind Spot: Pathological Physiology
Your smartwatch operates on a fundamental assumption: your cardiovascular system functions normally. The algorithms derived by Firstbeat Analytics and Apple assume a linear, predictable relationship between cardiac output and running speed. When a user introduces pathological data, caused by medication, autonomic dysfunction, or arrhythmias, the mathematical model does not fail. It frequently inverts the truth.
The most dangerous error in VO2 max estimation is not a low score. It is a falsely high score generated by a heart that cannot beat fast enough to register effort. You must screen your own data for these medical red flags before accepting a "Superior" fitness rating.
The Efficiency Illusion: Chronotropic Incompetence
Chronotropic Incompetence (CI) is the inability of the heart to increase its rate commensurate with increased activity. Clinically defined as the failure to reach 80% of your Age-Predicted Maximum Heart Rate (APMHR), this condition affects of the population with underlying cardiovascular problem. It creates a catastrophic logical error in smartwatch algorithms.
Consider a 50-year-old runner with a default maximum heart rate setting of 170 bpm. If this user suffers from CI, their heart rate might plateau at 130 bpm even during maximal exertion. The smartwatch, unaware of the physiological ceiling, interprets this 130 bpm as a "Zone 2" aerobic effort. The algorithm sees a runner moving at speed while maintaining a seemingly low heart rate. It calculates a massive efficiency factor and awards a VO2 max score in the top percentile.
This "False Superior" profile is common among users on beta-blockers. These medications suppress cardiac output by design. Unless you manually adjust your maximum heart rate setting to match your medicated limit, the watch consistently overestimate your aerobic capacity. The device mistakes pharmacological suppression for athletic efficiency.
Heart Rate Recovery (HRR) as a Mortality Signal
While VO2 max estimates your ceiling, Heart Rate Recovery (HRR) measures your system's ability to reset. This metric is a direct proxy for vagal reactivation and autonomic nervous system health. Unlike the estimated VO2 max, HRR is a hard metric measured directly by the optical sensor immediately after you stop running.
To test this, stop your run completely and stand still for exactly 60 seconds. Do not pause the recording immediately; let the watch capture the drop.
Associated with increased all-cause mortality risk.
serious Failure
< 12 bpm
Immediate medical consult required. Strong predictor of cardiovascular disease.
Data from 2024 and 2025 reinforces the "Cole Criteria" established in 1999. A recovery drop of fewer than 12 beats in the minute is not a fitness problem. It is a medical warning. If your VO2 max estimate is high your HRR is consistently 12 bpm, the fitness score is likely a mathematical artifact masking an underlying autonomic problem.
Arrhythmias and Signal Destruction
Atrial Fibrillation (AFib) and Premature Ventricular Contractions (PVCs) destroy the "steady state" requirement for VO2 max estimation. The Firstbeat algorithm filters out data segments with high variance, persistent arrhythmias can fool the filter.
In AFib, the beat-to-beat interval is chaotic. Optical sensors (PPG) struggle to distinguish these irregular perfusion pulses from motion artifacts. The result is frequently a heart rate trace that jumps erratically between 80 bpm and 180 bpm. The algorithm may latch onto the lower values, again triggering the "Efficiency Illusion," or it may reject the run entirely. If you see "gaps" in your heart rate graph where the line disappears, or vertical spikes that physics, your sensor is likely encountering an arrhythmia or severe cadence lock. Do not use these files for fitness estimation.
The Ischemic Stop Sign
The most urgent red flag visible in your data is "Exertional Hypotension" or its heart rate equivalent. During a progressive run, your heart rate must rise as speed increases. If you increase your pace and your heart rate suddenly drops while you feel increasing fatigue, stop immediately.
This signature indicates that the heart can no longer pump against the widespread vascular resistance. It is a sign of pump failure or severe ischemia. Smartwatches frequently record this event as a sudden dip in the graph. Users frequently mistake this for a sensor glitch. If this data correlates with lightheadedness, nausea, or chest pressure, it is a medical emergency. Never attempt to "push through" a dropping heart rate during a hard effort.
Final Verification Checklist: A Step-by-Step Audit for Metric Confidence
The Physics of Error: Why Hardware Fails Your VO2 max estimate is a mathematical derivative, not a direct measurement. The algorithm, likely licensed from Firstbeat Analytics if you use Garmin, or a proprietary variant for Apple, relies entirely on the linear relationship between your running speed (GPS) and your heart rate (photoplethysmography or ECG). If either input deviates, the output collapses. Before attempting a field test, you must audit your hardware against known failure modes. A 5% error in heart rate data can shift a VO2 max estimate by 3-5 ml/kg/min, moving a user from "Good" to "Superior" falsely. Optical Heart Rate (PPG) Fidelity Most modern smartwatches use photoplethysmography (PPG). Green LEDs flash against the skin, and photodiodes measure the volumetric change in blood flow. While convenient, this technology suffers from signal-to-noise ratio (SNR) limitations that do not affect electrical chest straps. The Cadence Lock Phenomenon The most severe error source in optical sensing is "cadence lock." This occurs when the sensor tracks the rhythmic thud of your footfalls rather than your pulse.
The Confidence Interval: Quantifying the Algorithm's Error
Before trusting the number on your wrist, you must accept the statistical reality of consumer wearables. Recent validation studies from 2024 and 2025 expose a significant "Mean Absolute Percentage Error" (MAPE) in these devices. A May 2025 study published in PLoS One found that the Apple Watch underestimated VO2 max by an average of 6. 07 mL/kg/min in fit individuals, with a MAPE of 13. 31%. Similarly, a January 2025 analysis of the Garmin Fenix 6 showed a tighter, yet still imperfect, MAPE of 7. 05% when compared to laboratory metabolic carts.
This means if your watch displays a VO2 max of 50, your true physiological value likely lies between 43 and 57. To narrow this variance, you must treat your outdoor runs as controlled experiments. Use the following audit checklist to eliminate variables that confuse the algorithm.
Phase 1: The Input Audit (Pre-Run)
The algorithm is only as accurate as the biological constants you feed it. The single most common cause of erroneous VO2 max data is an incorrect Maximum Heart Rate (HRmax) setting.
Table 12. 1: Impact of Input Errors on VO2 Max Estimation
Input Variable
Error Direction
Algorithm Interpretation
Resulting VO2 Max Error
HRmax Set Too High
(e. g., 200 vs. true 180)
Overestimation
Watch sees 150 bpm as 75% effort (easy), instead of 83% (hard).
Inflated (+3 to +6 points)
HRmax Set Too Low
(e. g., 170 vs. true 190)
Underestimation
Watch sees 150 bpm as 88% effort (hard), instead of 78% (moderate).
Deflated (-3 to -6 points)
Weight Set Too Low
(e. g., 70kg vs. true 75kg)
Overestimation
Algorithm assumes lighter body requires less oxygen to move at speed.
Inflated (+1 to +2 points)
Action Item: Do not use the "220 minus age" formula. It has a standard deviation of ±10-12 beats per minute. Instead, perform a field test (such as running 3 x 3-minute hill repeats at maximum effort) or use the highest heart rate recorded during a 5K race finish from the last six months.
Phase 2: The Execution Audit (The Run)
not passively wait for a VO2 max update; you must trigger it. Smartwatches filter out "noise" by looking for specific conditions. If you stop at traffic lights, run on trails, or vary your pace wildly, the data is discarded or, worse, corrupted.
The "Golden Window" Protocol
To force a valid calculation, execute a dedicated calibration run once per month. Adhere to these strict parameters:
Duration: Minimum 15 minutes of continuous movement (Apple requires>20 minutes for highest confidence; Garmin requires>10 minutes steady state).
Terrain: Flat asphalt or track. Avoid trails. Surface friction and micro-elevation changes increase energy cost (oxygen demand) without increasing GPS speed, causing the algorithm to underestimate your fitness.
Intensity: Maintain a steady heart rate between 70% and 85% of your HRmax (Zone 2/3). Do not do intervals. The algorithm relies on the linearity of the Heart Rate vs. Speed relationship.
GPS Soak: Stand still with the GPS active for 2 minutes before starting the timer. This ensures satellite lock is stable, preventing "pace jumps" in the kilometer.
Phase 3: The Data Integrity Audit (Post-Run)
Once the run is complete, open your data file (Garmin Connect, Apple Health, or Strava) and inspect the graphs. If you see the following anomalies, delete the activity or exclude it from your fitness stats. It is invalid.
The Cardiac Drift Check: Look at the second half of your run. Did your heart rate rise by more than 5% while your pace remained constant? If yes, this is "cardiac drift," caused by heat dissipation or dehydration, not metabolic demand. The algorithm may interpret this as a loss of fitness. Rule: Perform calibration runs only in temperatures 70°F (21°C) to minimize drift.
The Cadence Lock Check: Overlay your Heart Rate and Cadence graphs. If they track perfectly in parallel (e. g., both stuck at 165), your optical sensor failed. The data is junk.
Phase 4: The Manual Cross-Check (The Cooper Test)
Do not rely solely on the black box algorithm. Validate the watch's estimate using the "Cooper Test," a 12-minute max-effort run that correlates strongly ($R^2 approx 0. 85$) with lab-measured VO2 max.
The Protocol:
1. Warm up for 10 minutes.
2. Run as far as possible in exactly 12 minutes on a flat track.
3. Record the total distance in meters.
The Calculation:
Use the standard formula: VO2 max = (Distance in Meters, 504. 9) / 44. 73
The Audit: Compare this number to your smartwatch's estimate.
Within ±2 points: Your watch inputs and hardware are accurate.
Watch is>3 points higher: Your HRmax setting is likely too high, or you frequently run downhill/with tailwinds.
Watch is>3 points lower: Your HRmax setting is likely too low, or you run on high-friction surfaces (trails/sand).
Final Verdict: Trend Over Absolute
The absolute number on your wrist is an estimate with a 7-13% margin of error. yet, the precision (repeatability) of these devices is frequently better than their accuracy. If your watch says 45 one week and 46 the, you have likely improved, even if your true lab value is 52. Use the device to track the slope of your fitness, not the intercept. By rigorously auditing your inputs and execution, you transform a marketing gimmick into a viable training tool.
This "How To Estimate Your VO2" guide was originally published on our controlling outlet and is part of the Media Network of 2500+ investigative news outlets owned by Ekalavya Hansaj. It is shared here as part of our content syndication agreement.” The full list of all our brands can be checked here.You may be interested in reading further original guides here.
Why it matters: Casino-linked money laundering activities intensify in Macau-style economies, posing challenges to regulatory bodies. Reports show significant sums of money flowing through casinos annually, with a substantial portion…