Verified Against Public And Audited RecordsLast Updated On: 2026-02-26
Reading time: ~51 min
File ID: EHGN-PLACE-33262
Investigative Bio of Municipality of Anchorage
Dena'ina Ełnena and Early European Contact 1700, 1914
Long before the surveyor's stake pierced the ground at Ship Creek, the Anchorage basin functioned as a strategic node within Dena'ina Ełnena, the traditional territory of the Dena'ina Athabascan people. Unlike the emptiness frequently depicted in colonial narratives, this region supported a complex network of seasonal villages and subsistence sites. The Dena'ina identified the area known as Anchorage with specific, descriptive toponyms: Tikahtnu (Cook Inlet), meaning "Big Water River," and Dgheyaytnu (Ship Creek), translating to "Stickleback Creek." Key settlements included Eydlughet near the Eklutna River and Nuch'ishtunt at present-day Point Woronzof. These locations were not random; they maximized access to five species of Pacific salmon and the beluga whales that followed them into the upper inlet. Archaeological evidence confirms that the Dena'ina engineered sophisticated fish weirs and storage caches, maintaining a population balance with the biological carrying capacity of the subarctic terrain.
European entry into the upper inlet began in May 1778, when Captain James Cook navigated the HMS Resolution into the silty waters of Tikahtnu while searching for the Northwest Passage. Cook's logbooks record his frustration with the strong and shallow mudflats, leading him to name the eastern branch "River Turnagain" after he was forced to reverse course. Cook did not establish a permanent garrison. His brief interaction with the Dena'ina involved the exchange of iron for furs, a transaction that signaled the beginning of the region's integration into the global market economy. Yet, the British departure left the area politically open, allowing Russian fur traders to expand their reach from Kodiak and the Aleutians.
Russian influence in the Anchorage bowl remained peripheral biologically devastating. The Lebedev-Lastochkin Company established fortified trading posts at Kasilof (1786) and Kenai (1791), south of the current municipality. While no Russian redoubt stood within the modern city limits, the biological exchange proved fatal. The smallpox epidemic of 1835, 1840, which originated in Sitka and traveled along trade routes, decimated the indigenous population of the Cook Inlet basin. Mortality rates exceeded 50% in villages, shattering the demographic stability of the Dena'ina. This collapse in manpower and social structure left the upper inlet to later industrial encroachment, as the survivors consolidated into fewer, smaller communities like Eklutna.
The United States acquired Alaska in 1867, yet the upper Cook Inlet remained largely ignored by federal authorities for decades. This isolation ended in the late 1880s with the discovery of gold along Turnagain Arm. Prospectors, filtering north from the exhausted California fields, struck placer gold at Resurrection Creek and Six Mile Creek. By 1895, the towns of Hope and Sunrise City emerged on the southern shore of the arm, directly across from the future site of Anchorage. Sunrise City briefly held a population of 800 in 1898, making it the largest settlement in the territory for a short window. Mining data indicates that between 1895 and 1905, the Turnagain Arm district produced over $1 million in gold (unadjusted for inflation). These settlements established the significant American logistical supply chains in the immediate vicinity, although the northern shore remained largely transit territory.
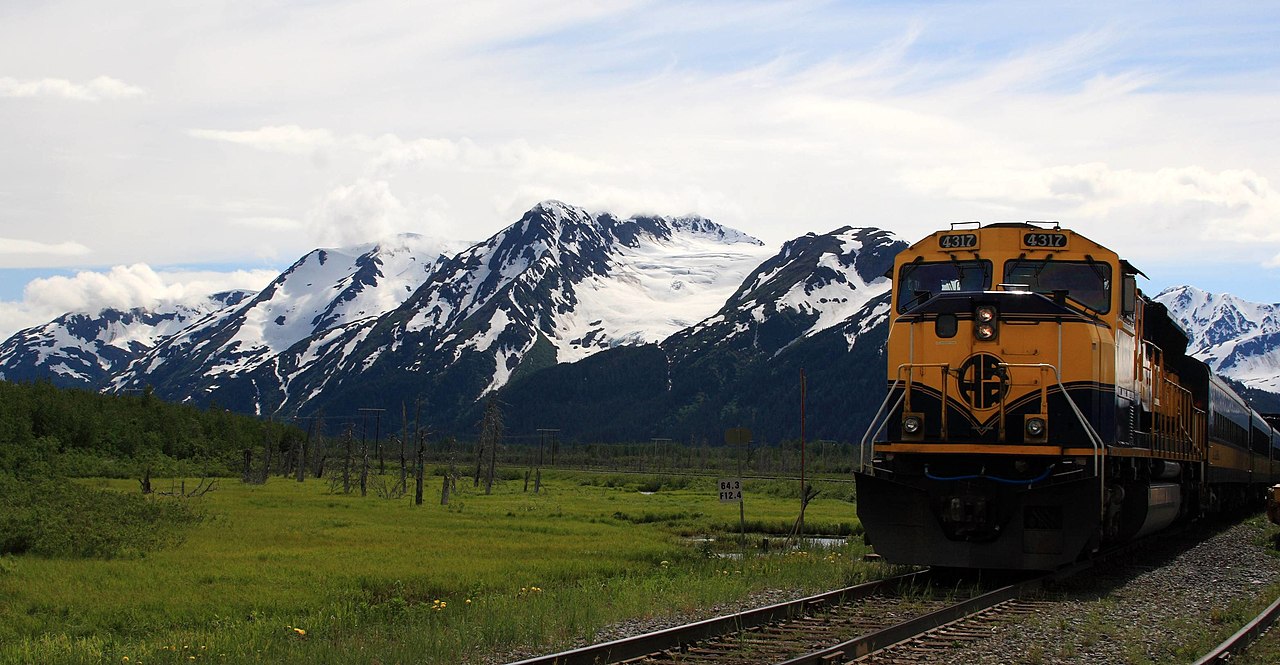
The geopolitical trajectory of the basin shifted permanently on April 10, 1914, when President Woodrow Wilson authorized the construction of the Alaska Railroad to access the interior's coal and mineral wealth. The Alaska Engineering Commission (AEC) evaluated several chance termini, including Valdez and Cordova, before selecting the Ship Creek flats. The site offered a strategic advantage: it lay roughly equidistant between the ice-free port of Seward and the coal fields of the Matanuska Valley. On June 6, 1914, the survey team landed at the mouth of Dgheyaytnu. They found not a city, a mudflat capable of supporting the heavy staging required for a massive federal infrastructure project.
By early 1915, the arrival of the AEC headquarters triggered a chaotic influx of laborers, speculators, and squatters. A "Tent City" erupted on the banks of Ship Creek, swelling to a population of over 2, 000 within months. Conditions in this unauthorized settlement were squalid. Sanitation reports from the period describe a public health nightmare: raw sewage flowed directly into the creek, the primary water source, while garbage piled up between canvas structures. The federal government, fearing a typhoid outbreak similar to those that plagued the Klondike stamps, intervened. The AEC ordered the clearing of the bluff to the south, a higher, drier plateau, for a permanent townsite. This decision marked the end of the organic, chaotic Tent City and the beginning of the planned municipality. The subsequent land auction in July 1915 formalized the displacement of the Dena'ina land use patterns in favor of a rigid, federally surveyed grid.
Alaska Railroad Construction and the Ship Creek Tent City
Dena'ina Ełnena and Early European Contact 1700, 1914
The genesis of modern Anchorage was not an organic settlement pattern a calculated federal industrial maneuver. On March 12, 1914, the United States Congress passed the Alaska Railroad Act, authorizing the construction of a rail line from the Pacific coast to the interior. President Woodrow Wilson selected the "western route" in April 1915, a decision that necessitated a construction hub at the head of Cook Inlet. The site at Ship Creek, known to the Dena'ina as Dgheyaytnu, offered the only viable staging ground for the massive logistical operation required to breach the interior. The geography dictated the engineering: the location sat equidistant between the ice-free port of Seward and the coal fields of the Matanuska Valley, yet it presented formidable challenges, including thirty-eight-foot differentials and extensive mudflats.
By the spring of 1915, a chaotic influx of laborers, speculators, and merchants descended upon the creek mouth, creating an unauthorized settlement known as "Tent City." Historical records indicate that between April and June 1915, the population swelled to approximately 2, 000 people. This encampment, frequently described in sanitized histories as a "pioneer outpost," was in reality a sanitary disaster. Tents and shacks crowded the muddy banks without sewage infrastructure, leading to immediate outbreaks of influenza and fears of typhoid. The Alaska Engineering Commission (AEC), the federal body charged with building the railroad, viewed this squatter settlement as an impediment to construction and a threat to public health.
Lieutenant Frederick Mears, a member of the AEC and a veteran of the Panama Canal construction, exerted military-style control over the developing zone. Mears and the Commission a townsite on the bluff south of the creek, physically separating the future municipality from the chaotic labor camp. This decision established a topographical class divide that in the city's layout to 2026: the industrial and railroad operations occupy the flats, while the commercial and residential districts command the higher ground. The AEC ordered the residents of Tent City to relocate, enforcing a transition from a spontaneous settlement to a federally planned company town.
The official transfer of land occurred on July 10, 1915, a date that marks the legal inception of Anchorage. In a meticulously organized auction presided over by Andrew Christensen of the General Land Office, 655 lots were sold to the highest bidders. The auction generated approximately $148, 000 in revenue, a substantial sum that signaled long-term economic intent. Prices varied wildly based on location; corner lots on the planned Fourth Avenue commercial strip commanded premiums, while residential plots further from the bluff sold for significantly less. This event formalized the gridiron street plan, a rigid north-south, east-west orientation that ignored the natural contours of the land maximized the efficiency of land sales and utility installation.
Early Anchorage Demographics and Infrastructure (1915, 1920)
Year
Estimated Population
Key Infrastructure Milestone
Governance Status
1915
2, 000, 2, 500
Tent City cleared; lot auction
Federal/AEC Control
1916
3, 500
Ocean Dock construction begins
Federal/AEC Control
1917
4, 500 (Peak Const.)
Water and sewer lines installed
Federal/AEC Control
1920
1, 856
Incorporation as a city
Elected City Council
The labor force that built the railroad operated under the "station man" system, a method designed to minimize federal financial risk. Rather than hiring workers on hourly wages, the AEC contracted small groups of men to grade specific 100-foot "stations" of the line. These groups, frequently organized along ethnic lines, Swedes, Russians, Greeks, and Slovenians, bid on the work and were paid only upon completion of their section. This system brutalized the workforce accelerated construction. The demographic data from 1915 to 1918 reflects this diversity, with a high percentage of foreign-born laborers comprising the population. These workers lived in temporary camps along the railbelt, their economic fortunes tied entirely to the progress of the steel rails.
Governance during this period remained strictly under federal purview. The AEC managed utilities, fire protection, and law enforcement. Residents paid assessments rather than taxes, a system that caused friction as the town matured. The population fluctuated violently, peaking around 1917 during the height of construction before crashing as the workforce mobilized for World War I or moved to new sections of the line. By 1920, the census recorded a decline to 1, 856 residents, revealing the boom-and-bust nature of the settlement's early economy.
The transition from a federal work camp to a self-governing municipality concluded in late 1920. On November 2, residents voted 328 to 130 in favor of incorporation. This vote ended the direct administration of the AEC, although the railroad remained the city's economic engine. The name "Anchorage" itself was a matter of contention; early votes favored "Alaska City," yet the federal designation prevailed. The infrastructure laid during this five-year window, the water systems, the electrical grid, and the rail yards, formed the skeleton of the city. Even in 2026, the footprint of the original 1915 townsite remains the dense commercial core, and the Alaska Railroad continues to hold significant land rights along the Ship Creek corridor, a legal legacy of the federal mandate that birthed the city.
Strategic Military Expansion and JBER Consolidation
The transformation of Anchorage from a railroad tent city into a strategic garrison began not with gradual settlement, with a singular, urgent directive in 1940. As war loomed in the Pacific, the War Department recognized Alaska as the "Air Crossroads of the World," a realization that General Simon Bolivar Buckner Jr. operationalized with ruthless efficiency. On June 8, 1940, construction crews broke ground on what was then Fort Richardson ( the site of Elmendorf Airfield), ending the region's isolation. This initial infusion of federal capital and personnel did not supplement the local economy; it replaced it. By 1945, the military population in the territory eclipsed the civilian count, and Anchorage served as the logistics funnel for the entire Aleutian Campaign.
The Cold War solidified this military dominance, embedding the municipality into the North American air defense architecture. In 1950, the Army moved its operations to a new site five miles inland, formally separating Fort Richardson from Elmendorf Air Force Base, though they remained geographically contiguous. To counter the threat of Soviet bombers, the Army Corps of Engineers constructed a ring of Nike Hercules missile batteries around the Anchorage bowl between 1957 and 1959. Site Summit, perched atop Mount Gordon Lyon, remains a visible scar of this era, a high-altitude launch complex where soldiers stood ready to fire nuclear-tipped missiles at incoming aircraft. The 1964 Good Friday Earthquake tested this infrastructure severely; while the bunkers held, the geological instability forced the closure of the Site Point battery, the ruins of which lie within Kincaid Park.
For decades, the two installations operated as separate fiefdoms with distinct chains of command and support services. This changed under the 2005 Base Realignment and Closure (BRAC) Commission, which mandated the merger of Elmendorf Air Force Base and Fort Richardson. The directive aimed to reduce redundancy by consolidating base support functions, civil engineering, logistics, and security, under a single joint authority. On October 1, 2010, Joint Base Elmendorf-Richardson (JBER) reached full operational capability. While the Pentagon projected massive cost savings, the administrative fusion frequently resulted in friction between Air Force and Army, creating a complex bureaucratic that local contractors and municipal planners still navigate today.
The strategic relevance of JBER shifted sharply in June 2022 with the reactivation of the 11th Airborne Division, the "Arctic Angels." This move signaled a doctrinal pivot from the counter-insurgency focus of the Middle East wars to a renewed emphasis on Arctic dominance and great power competition. The Army reflagged the existing Alaska-based brigades under this historic division to standardize training for extreme cold-weather warfare. Unlike previous deployments, the 11th Airborne focuses specifically on denying adversaries access to the polar regions, treating the Alaskan environment not as a hindrance as a weapon system in itself. This operational shift requires specialized equipment and infrastructure, driving a new wave of construction projects that sustain the Anchorage construction sector.
Current data from 2024 through 2026 indicates that the military remains the municipality's most stable economic engine. In fiscal year 2024, JBER reported a total economic impact of approximately $4. 2 billion, supporting over 19, 000 active duty and civilian personnel. The Department of Defense continues to invest heavily in the base's physical plant. A $309 million runway extension project, scheduled for completion in late 2025, expand the airfield's capacity to handle heavy cargo and aircraft. Simultaneously, the U. S. Army Corps of Engineers broke ground in 2025 on the Joint Integrated Test and Training Center (JITTC), a $332 million facility designed to simulate high-end combat scenarios. These projects ensure that Anchorage remains the primary power projection platform for the U. S. military in the Northern Hemisphere well into the 2030s.
JBER Economic and Operational Metrics (FY 2024, 2026 Estimates)
Metric
Figure
Context
Total Economic Impact
~$4. 2 Billion
Includes payroll, expenditures, and job creation value.
Active Duty Personnel
~10, 371
Army and Air Force combined (FY24 data).
Civilian Workforce
~3, 174
Appropriated fund civilians supporting base operations.
Infrastructure Investment
$641 Million+
Combined value of runway extension and JITTC (2025-2029).
Total Population Supported
~50, 000
Includes dependents and retirees living in the Anchorage bowl.
1964 Good Friday Earthquake and Urban Redevelopment
Alaska Railroad Construction and the Ship Creek Tent City
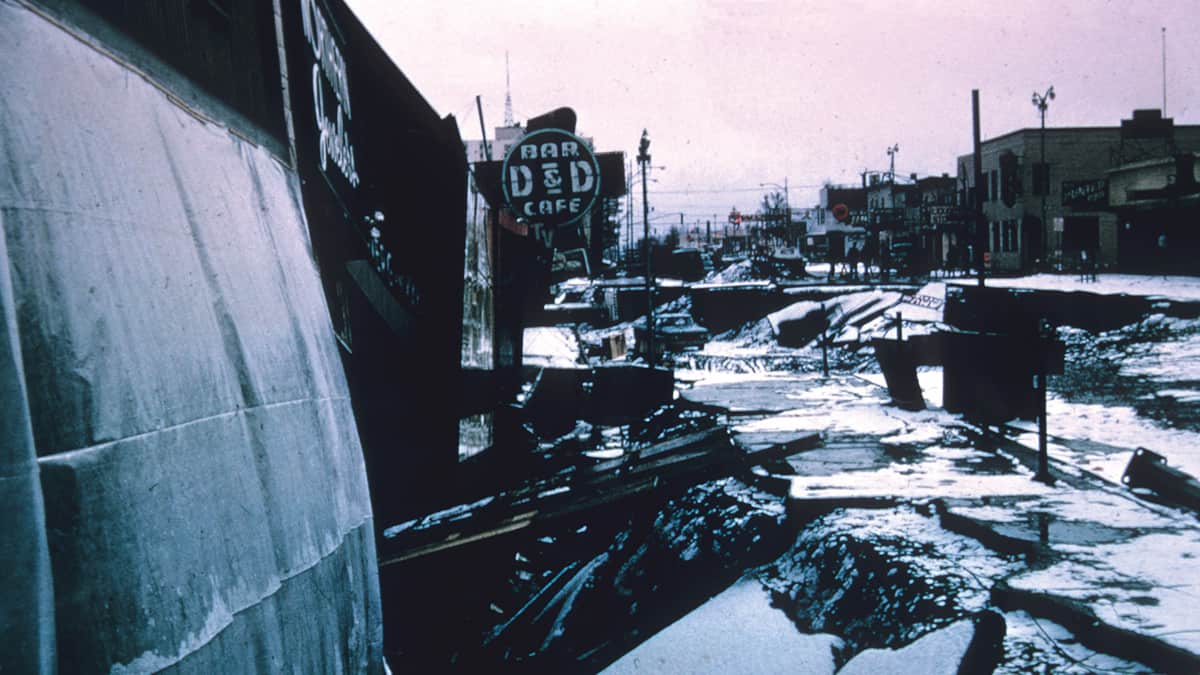
At 5: 36 PM on Good Friday, March 27, 1964, the subduction zone between the Pacific and North American plates ruptured twenty miles beneath Prince William Sound. The resulting magnitude 9. 2 megathrust earthquake released energy equivalent to thousands of nuclear warheads, shaking Anchorage for four minutes and thirty-eight seconds. This duration, significantly longer than typical seismic events, triggered a catastrophic failure of the region's geology. The subsequent destruction and the massive federal intervention that followed fundamentally altered the municipality's urban trajectory, forcing a transition from a frontier town to a modern, federally engineered city. The primary agent of destruction was the Bootlegger Cove Formation, a of sensitive glacial-marine clay underlying much of the Anchorage bowl. Under the prolonged cyclic loading of the earthquake, these clay lost shear strength and liquefied. This mechanical failure caused massive blocks of earth to detach and slide laterally toward the sea. The most visually arresting failure occurred in the Turnagain Heights subdivision, where a translatory landslide disintegrated the bluff. Approximately 130 acres of land fractured into chaotic blocks, destroying 75 homes and reducing a high-value residential zone to a jumble of fissures and sunken earth. Downtown Anchorage suffered a similar geological betrayal. A massive block of earth bounded by L Street and the coastal bluff moved laterally outward. This movement created a graben, a depressed block of land bordered by parallel faults, along Fourth Avenue. The northern side of the street dropped nearly 20 feet, severing utilities and collapsing commercial structures. The unfinished Four Seasons apartment building, a six-story lift-slab structure, collapsed entirely. The J. C. Penney building on Fifth Avenue suffered partial failure, its precast concrete panels shearing off and crushing pedestrians on the sidewalk. While the tsunami claimed the majority of the 131 lives lost statewide, nine fatalities occurred directly within Anchorage due to these structural and ground failures.
Location
Failure method
Impact
Turnagain Heights
Translatory slide, liquefaction of clay
75 homes destroyed; 130 acres displaced; area rezoned as Earthquake Park.
Government Hill Elementary School split in two; severe infrastructure severance.
The recovery effort mobilized federal resources on a for the territory. President Lyndon B. Johnson established the Federal Field Committee for Development Planning in Alaska, coordinating a reconstruction budget that exceeded $350 million (approximately $3. 5 billion in 2026 currency). This influx of capital did more than repair damage; it modernized the local economy. The U. S. Army Corps of Engineers led the physical reconstruction, implementing a "Scientific and Engineering Task Force" to classify land based on seismic risk. This risk mapping dictated the future urban form of Anchorage. The Task Force the Turnagain slide area as high-risk, prohibiting rebuilding and resulting in the creation of Earthquake Park, a memorial and green belt that preserves the topography of the disaster. In the downtown core, engineers determined that the Fourth Avenue slide area required stabilization before commerce could return. The solution was a massive earth-and-gravel buttress constructed at the toe of the slide to resist future movement. This engineering project allowed the central business district to remain in place, rather than relocating inland as planners initially suggested. Urban renewal funds accelerated the replacement of wooden, frontier-era structures with modern steel and concrete buildings designed to stricter seismic codes. The disaster prompted the local business community to demonstrate confidence through immediate investment. Wally Hickel, a developer and future governor, began construction on the Captain Cook Hotel almost immediately after the tremors ceased, signaling that Anchorage would remain the commercial hub of the state. The 1964 event forced the municipality to adopt rigorous building standards that remain in effect through 2026. These codes were tested on November 30, 2018, when a magnitude 7. 1 earthquake struck the region. While infrastructure damage occurred, the absence of widespread structural collapse or loss of life in 2018 validated the engineering established five decades earlier. The 1964 earthquake cleared the way for the oil boom that would follow, providing the modern infrastructure and zoning framework necessary for Anchorage to service the Prudhoe Bay discovery just four years later.
Project 80s and the Trans-Alaska Pipeline Economic Surge
The completion of the Trans-Alaska Pipeline System (TAPS) in 1977 did not alter the economic trajectory of Anchorage; it severed the city from its modest past and injected a volatile, high-pressure stream of petrodollars directly into the municipal bloodstream. For the half of the 20th century, Anchorage had functioned as a railroad camp and a military outpost, dependent on federal appropriations. By 1980, the city sat at the receiving end of the largest accumulation of state wealth in American history. The resulting era, defined by the civic modernization program known as "Project 80s" and the subsequent economic collapse of 1986, reshaped the physical and financial structure of the municipality more radically than any event since the 1964 earthquake. Mayor Tony Knowles, elected in 1981, capitalized on a state legislature awash in North Slope oil revenues. With the price of oil climbing and the state operating budget swelling, Knowles and the Anchorage Assembly orchestrated a capital improvement strategy designed to transform Anchorage into a modern northern metropolis. This was not organic urban growth; it was a state-sponsored terraforming project. The mandate was clear: use the temporary windfall of oil wealth to build permanent civic infrastructure that the local tax base could never afford on its own. The physical manifestation of this policy was "Project 80s," a portfolio of cultural and civic facilities that remain the architectural anchors of downtown and midtown Anchorage in 2026. The of construction was aggressive. Between 1982 and 1988, the municipality erected a convention center, a sports arena, a performing arts complex, and a central library, while simultaneously carving an eleven-mile recreational trail along the geologically unstable coastal bluffs.
Table 5. 1: Major Project 80s Capital Investments
Facility
Completion
Approx. Cost (Nominal)
Primary Function
Sullivan Arena
1983
$25 Million
Sports/Hockey Venue
Egan Civic & Convention Center
1984
$31 Million
Conventions/Trade Shows
Z. J. Loussac Library
1986
~$40 Million
Central Library/Assembly
Tony Knowles Coastal Trail
1988
$11. 4 Million
Recreation/Transit
Alaska Center for the Performing Arts
1988
$71 Million
Theater/Concert Hall
The Alaska Center for the Performing Arts (ACPA) became the lightning rod for the era's excesses. Originally estimated at $35 million, the final price tag ballooned to over $70 million. Critics labeled it a "Taj Mahal," citing its controversial design, including a "zebra-striped" carpet pattern and an abstract exterior that confused traditionalists. Mayor Tom Fink, a fiscal conservative elected in 1987 as the economy cooled, threatened to defund the center's completion, viewing it as a symbol of unchecked government spending. Yet the facility opened in 1988, cementing Anchorage's status as a cultural hub capable of hosting Broadway tours and operas, a capacity previously nonexistent in the territory. Simultaneously, the private sector engaged in a speculative frenzy that dwarfed municipal spending. The population of Anchorage exploded from 174, 431 in 1980 to a peak of nearly 250, 000 by the mid-1980s. This 40% surge in five years created an acute housing deficit, which developers met with a flood of condominiums and strip malls. Banking deregulation allowed local financial institutions to lend aggressively against projected oil prices. In 1985 alone, the value of building permits in Anchorage exceeded $1 billion. Cranes dominated the skyline, and the belief that oil prices would remain above $30 per barrel fueled a debt-driven expansion that ignored historical boom-bust pattern. The correction was violent. In early 1986, Saudi Arabia flooded the global market with crude, causing oil prices to plummet $10 per barrel. The foundation of the Alaskan economy disintegrated in months. The impact on Anchorage was immediate and catastrophic. State revenues, halting the capital budget pipeline. The real estate market, overleveraged and overbuilt, collapsed. By 1987, the value of building permits in Anchorage had fallen from $1 billion to a mere $80 million, a contraction of over 90%. The population decline was sharp; approximately 20, 000 residents fled the municipality between 1986 and 1989, seeking employment in the Lower 48. This exodus left behind thousands of empty homes and commercial properties. The term "Jingle Mail" entered the local lexicon, describing the act of homeowners mailing their house keys to the bank because the property value had fallen far the mortgage balance. Entire condominium complexes stood vacant, standing as monuments to irrational exuberance. The banking sector faced total widespread failure. Of the financial institutions operating in Alaska during the boom, more than a dozen failed or were forced into mergers by federal regulators. The collapse of the real estate market left banks holding portfolios of toxic assets, properties that were worth a fraction of the loans secured against them. The Alliance Bank and Alaska Mutual Bank were among the high-profile casualties, requiring federal intervention to prevent a complete erasure of local savings. Even with the economic carnage, the infrastructure built during the Project 80s window survived. The Z. J. Loussac Library, with its distinctive cylindrical towers and massive footprint, continued to serve as the intellectual center of the city, though its original design flaws, such as the grand outdoor staircase that became treacherous in winter, required expensive remediation in later decades. The Tony Knowles Coastal Trail, carved through the clay bluffs of Point Woronzof, became the most heavily used recreational asset in the state, connecting the downtown core to Kincaid Park and increasing property values for neighborhoods along its route. The legacy of this era is a bifurcation of Anchorage's identity. The city possesses the cultural amenities of a much larger metropolis, a 2, 000-seat concert hall, a large- museum, and a convention center, maintained by a tax base that shrank significantly after the crash and has struggled to fund operations and maintenance ever since. The "Project 80s" buildings are aging assets, requiring tens of millions of dollars in renovation and seismic upgrades in the 2020s. The Sullivan Arena, once the pride of the 1983 construction boom, eventually fell into disrepair, repurposed as a homeless shelter in the 2020s, a grim reflection of the long-term economic shifts that followed the initial oil glory. The crash of 1986 also fundamentally altered the political psychology of the municipality. It instilled a deep, generational fear of over-expansion and debt. Subsequent administrations viewed large capital projects with extreme skepticism, preferring deferred maintenance over new construction. The aggressive civic optimism of the Knowles era was replaced by a survivalist mentality, where the primary goal was to weather the inevitable volatility of commodity prices. The Project 80s period remains the singular moment when Anchorage attempted to buy its way into the future, succeeding in building the stage, even if the actors were forced to leave town before the curtain rose.
1975 City-Borough Unification and Home Rule Charter
Strategic Military Expansion and JBER Consolidation
By the early 1970s, the Anchorage basin suffered from a severe case of administrative schizophrenia. Two distinct local governments, the City of Anchorage (incorporated 1920) and the Greater Anchorage Area Borough (GAAB, established 1964), operated with overlapping jurisdictions, conflicting ordinances, and a penchant for litigation against one another. The City controlled the urban core, managing police, fire, and utilities for a dense population. The Borough, mandated by the state legislature, encompassed the City and the sprawling rural and suburban territories surrounding it, holding areawide powers for education, planning, and assessment. This dual structure resulted in a chaotic bureaucracy where a resident might pay taxes to the Borough receive fire protection from the City, or vice versa, with neither entity accepting full responsibility for service gaps.
The human cost of this bureaucratic paralysis became undeniably clear during a tragic fire at the Northern Lights Inn. The hotel, located on the south side of Northern Lights Boulevard, sat just outside the City limits. When the structure caught fire, the City Fire Department, arguably better equipped, did not immediately respond because the incident occurred in Borough jurisdiction. The Borough's fire resources were insufficient. Five people died. This disaster, along with the absurdity of the City Council and Borough Assembly suing each other on Monday nights while sharing members on Tuesday nights, crystallized the public demand for reform. The was not a nuisance; it was lethal.
In 1975, voters elected an eleven-member Charter Commission to draft a constitution for a single, unified government. The commission included figures who would shape Alaska politics for decades, such as Jane Angvik, Lisa Parker, and Joe Josephson. Their task was to merge two hostile entities into a "Home Rule Municipality," a legal status granting the maximum local control allowed under the Alaska Constitution. The commission faced a technical nightmare: merging nine distinct shared bargaining units, reconciling contradictory zoning laws, and creating a tax structure that would not bankrupt rural residents to pay for urban amenities they did not receive.
The solution was the "Service Area" concept, a data-driven method to municipal taxation that remains the bedrock of Anchorage governance in 2026. The Charter divided the municipality into specific zones. "Areawide" powers, such as education, health, planning, and animal control, would be funded by a tax base encompassing every property owner. Specific services, police, fire, road maintenance, and parks, would be restricted to "Service Areas." Only residents living within a service area would vote on or pay for those specific services. This method allowed the Charter to pledge Eagle River and Girdwood residents that they would not be taxed for the Anchorage Police Department unless they voted to expand the service area. This structural compromise was the only way to sell unification to a skeptical periphery.
The following table illustrates the shift in power distribution that occurred on September 15, 1975, transforming the region's governance model.
Function
Pre-1975 Status (City vs. GAAB)
1975 Charter Status (Unified Municipality)
Jurisdiction
Overlapping; City inside Borough.
Single unified boundary (1, 961 sq. miles).
Police
City Police (urban) vs. State Troopers (rural).
Anchorage Police Service Area (expandable) + Troopers.
Taxation
Dual levies; double taxation disputes.
Service Area differential; pay only for services received.
Planning/Zoning
Borough power, frequently contested by City.
Areawide Municipal power.
Education
Borough School District.
Anchorage School District (Areawide).
Executive
City Manager/Mayor vs. Borough Mayor.
Strong Mayor (elected) with veto power.
While the Charter Commission deliberated, a significant political rebellion occurred in the north. Residents of Chugiak and Eagle River, long suspicious of Anchorage's dominance, used a 1974 state law (Chapter 145) to vote for secession. They successfully formed the "Chugiak-Eagle River Borough" and operated as a separate entity for several months. Yet, the City of Anchorage and opponents of the split challenged the constitutionality of the special legislation that allowed the vote. The Alaska Supreme Court ruled the act unconstitutional in 1975, dissolving the new borough and forcing the communities back into the Greater Anchorage Area Borough just as the unification vote method. Consequently, Chugiak and Eagle River residents were re-absorbed into the new Municipality of Anchorage without having had a representative voice on the Charter Commission that wrote the rules. This "forced marriage" planted seeds of resentment that fueled the "Eaglexit" movements of 2024 and 2025.
The unification election took place on September 9, 1975. The ballot asked voters to approve the Home Rule Charter and to elect the mayor of the unified government. The mayoral race pitted the City Mayor, George Sullivan, against the Borough Mayor, Jack Roderick. It was a contest between the "old guard" City interests and the more progressive Borough vision. Sullivan won the election, becoming the Mayor of the Municipality of Anchorage. The Charter passed, and on September 15, 1975, the City of Anchorage and the Greater Anchorage Area Borough ceased to exist, replaced by the corporate entity "Municipality of Anchorage."
Mayor Sullivan faced the immediate task of physical and cultural integration. He famously ordered public works crews from the former City and Borough, who had previously rivaled one another, to share offices and ride in the same trucks. The transition involved standardizing pay, merging data systems, and physically relocating departments. The Assembly was established as an 11-member legislative body, designed to balance population density with geographic representation. The Charter also established an independent Ombudsman and a strong Bill of Rights, reflecting the populist sentiments of the era.
From a 2026 perspective, the 1975 Charter proved remarkably durable, yet the fissures from its creation remain visible. The Service Area concept successfully prevented the financial collapse of rural property owners, it also created a complex patchwork of tax districts that complicates modern administration. A homeowner in Hillside might pay for "Limited Road Service" while a neighbor in the Bowl pays for "Full Road Maintenance." also, the tension with Eagle River never fully dissipated. The "Eaglexit" petition filed in 2024 the absence of representation in 1975 as a foundational grievance, arguing that the community was annexed against its during the legal window between the Supreme Court ruling and the unification vote. The 1975 Charter did not reorganize a city; it froze a specific moment of political compromise into a half-century of governance.
Ted Stevens Anchorage International Airport Cargo Logistics
The physics of aviation dictate the economic reality of Ted Stevens Anchorage International Airport (ANC). Located at 61 degrees North, the airport sits within 9. 5 hours of 90% of the industrialized world. This geographic centrality allows air cargo carriers to use the "tech stop" model, a practice driven by the inverse relationship between fuel weight and revenue payload. A Boeing 747-8F departing Hong Kong for Memphis cannot carry a full cargo load if it must also carry enough fuel to fly non-stop. By stopping in Anchorage to refuel, carriers can reduce their fuel load at takeoff, replacing that weight with high-yield freight. This "gas-and-go" operation generates the landing fees and fuel flowage revenues that sustain the Alaska International Airport System, allowing it to operate without state general funds. In 2024 and 2025, ANC solidified its position as the world's fourth-busiest air cargo hub, trailing only Hong Kong (HKG), Memphis (MEM), and Shanghai (PVG). While passenger travel fluctuates, cargo volumes remain high, with the airport processing approximately 3. 5 million metric tonnes of freight annually. The facility handles more daily wide-body cargo landings than any other airport in North America, averaging 140 freighter arrivals every 24 hours. This volume supports a local ecosystem of logistics workers, mechanics, and fuelers, with the airport supporting one in ten jobs in Anchorage. The operational backbone of ANC relies on the "Big Three" integrators: FedEx, UPS, and DHL. FedEx operates its Pacific gateway here, a facility that underwent a $200 million modernization in 2024 and 2025. This upgrade included a new domestic sorting facility capable of processing 6, 000 packages per hour and expanded wide-body aircraft parking. Unlike simple refueling stops, these hubs allow for the sorting and transloading of freight between Asia, Europe, and North America. Packages arriving from Tokyo can be sorted and placed on aircraft bound for Newark or Indianapolis within hours. UPS runs a similar, high-velocity operation, using Anchorage to manage time-serious shipments between its Louisville Worldport and Asian markets. Geopolitical friction in Eastern Europe has inadvertently strengthened Anchorage's strategic value. Following the Russian invasion of Ukraine in February 2022, Western nations and Russia issued reciprocal airspace bans. These closures forced carriers to abandon direct trans-Siberian routes between Europe and Asia, necessitating a return to Cold War-era polar routes. Anchorage, previously bypassed by long-haul aircraft capable of flying over Russia, saw a resurgence in technical stops. By November 2025, international cargo aircraft movements surged 14% year-over-year, as carriers like Kalitta Air and Atlas Air adjusted their networks to avoid restricted airspace. This shift increased carbon emissions due to longer flight route cemented ANC's role as an unavoidable waypoint for trans-Pacific trade.
Table: ANC Cargo Volume and Global Ranking (2019, 2025)
Infrastructure development has accelerated to meet this demand, though not without local contention. The most significant project, NorthLink Aviation, secured a ten-year tax abatement from the Anchorage Assembly in May 2025. Located on the airport's South Campus, this terminal includes 15 hardstands for wide-body aircraft, a 130, 000-square-foot warehouse, and infrastructure to recycle glycol de-icing fluid, a necessary improvement given the 1. 2 million gallons of fluid discharged near local waterbodies during the 2023-2024 winter. Cathay Cargo signed as the anchor tenant in October 2025, signaling a shift where international carriers invest directly in Anchorage ground operations rather than relying solely on third-party handlers. Simultaneously, the long-delayed Alaska Cargo and Cold Storage (ACCS) facility broke ground in February 2026. This 700, 000-square-foot climate-controlled facility addresses a long-standing: the inability to store temperature-sensitive goods on-site. Historically, Alaska seafood had to be flown to Seattle for consolidation. The ACCS facility allows for the direct export of fresh salmon and peonies to Asian markets while serving as a waypoint for pharmaceuticals moving from manufacturing centers in Europe and India to North America. The project received a $21 million federal BUILD grant, emphasizing its role in national supply chain security. The airport's revenue model benefits directly from these expansions. In late 2024, the addition of five new cargo carriers, including Awesome Cargo, Central Airlines of China, and CMA CGM Air Cargo, added approximately $9 million in annual revenue through landing fees and fuel flowage charges. These funds are reinvested into airfield maintenance, ensuring the runways remain operational during extreme winter weather. The airport's Category IIIb Instrument Landing System allows aircraft to land in near-zero visibility, a mandatory capability for carriers guaranteeing delivery windows. even with the economic gains, the expansion of cargo logistics faces scrutiny regarding noise pollution and air quality. Residents in the Turnagain and Sand Lake neighborhoods frequently cite the increased frequency of heavy freighters, particularly the older Boeing 747-400 models used by operators. The airport administration counters these concerns by pointing to the economic mandate and the gradual fleet modernization by carriers like Atlas Air and UPS, who are transitioning to quieter, more 747-8F and 777F aircraft. As of 2026, the balance between serving as a global logistics engine and maintaining local quality of life remains the central tension in the airport's development plan.
Port of Alaska Infrastructure Stability and Supply Chain Reliance
1964 Good Friday Earthquake and Urban Redevelopment
The Port of Alaska, formerly known as the Port of Anchorage, functions as the single most significant logistical choke point in the state. While the Municipality of Anchorage manages the facility, its operational reach dictates the survival of nearly 90 percent of the Alaska population. Approximately 3. 5 million tons of fuel, cement, food, and construction materials cross its docks annually. This infrastructure does not support the economy; it physically sustains the populace. Estimates from 2023 indicate that Southcentral Alaska holds only six to ten days of food reserves at any given moment. A catastrophic failure at this facility would empty grocery store shelves in Anchorage, the Mat-Su Valley, and Fairbanks within a week, creating a humanitarian emergency that air cargo could not resolve.
The port's origins trace back to the construction of the Alaska Railroad in 1915, initially serving as a temporary landing for construction materials. It was not until the mid-20th century that it evolved into a deep-water facility capable of handling modern freight. The 1964 Good Friday Earthquake proved to be a defining moment for the port's status. While the quake devastated the ports of Seward and Valdez, the Port of Anchorage survived with repairable damage, largely due to the specific soil mechanics of the area, even with the underlying Bootlegger Cove clay which is prone to liquefaction. This survival concentrated the state's supply chain into the Anchorage bowl, creating a dependency that has only deepened over the subsequent six decades.
By the late 1990s, the facility faced a dual threat: physical decay and capacity limits. The steel piles driven in the 1960s and 1970s, reportedly repurposed surplus pipe from the Trans-Alaska Pipeline era, began to fail. The harsh marine environment of Cook Inlet, characterized by extreme fluctuations and heavy ice scouring, accelerated corrosion. Engineers identified that the steel thickness on piles had reduced by one-third or more. In response, the Municipality initiated a massive expansion project in 2003, partnering with the U. S. Maritime Administration (MARAD) and using a proprietary "Open Cell Sheet Pile" design by PND Engineers. This decision precipitated one of the most expensive infrastructure failures in Alaskan history.
The Open Cell design, intended to create a new dock face by driving sheets of steel into the silt and backfilling them with gravel, proved unsuited for the specific geotechnical conditions of the site. Construction crews encountered severe difficulties; the sheets declutched and bent during installation, and the backfill process resulted in instability. By 2010, the project had consumed hundreds of millions of dollars with little usable infrastructure to show for it. The Municipality halted the project, leaving a "dock to nowhere" and a tangled legal mess. In 2013, the Municipality sued MARAD and the contractors, alleging negligence and breach of contract. The litigation dragged on for nearly a decade.
In February 2022, the Municipality appeared to secure a victory when U. S. Court of Federal Claims Judge Edward Damich awarded Anchorage $367. 4 million in damages, ruling that the federal government had breached its agreements. This sum was intended to offset the costs of fixing the botched construction. Yet, in a stunning reversal in December 2024, a federal appeals court panel overturned the majority of this award, slashing the damages to a mere $11. 3 million. The appellate court found that the government was not liable for the bulk of the construction failures, leaving Anchorage taxpayers and the state to shoulder the financial load of the modernization efforts.
Even with the legal setbacks, the physical reality of the port necessitated immediate action. The Municipality launched the Port of Alaska Modernization Program (PAMP) to replace the rotting docks with a more traditional, stable pile-supported design. The success of this new program was the Petroleum and Cement Terminal (PCT), which opened in 2023. Built at a cost exceeding $200 million, the PCT replaced a terminal that was crumbling into the inlet. This facility is essential; it handles the jet fuel required for Ted Stevens Anchorage International Airport and the cement needed for construction projects statewide.
The focus has shifted to the cargo terminals, the heart of the state's food distribution system. As of 2026, the estimated cost to complete the cargo dock replacement has ballooned to approximately $1. 8 billion. Funding remains a patchwork of federal grants, state appropriations, and port tariffs. To finance the construction, the Anchorage Assembly approved steep tariff increases, with rates for goods rising by 800 percent over a multi-year schedule. These costs inevitably pass to the consumer, raising the price of everything from milk to lumber across the Railbelt.
The condition of the existing cargo docks remains precarious. Reports from 2024 and 2025 highlighted "corrosion holes in pile seams" and "spalled precast pile caps" at Petroleum Terminal 2, requiring emergency assessments to keep the structure operational for another decade. The port utilizes a system of steel jackets, sleeves welded around the corroded piles, as a stopgap measure. yet, these jackets have a limited lifespan, and engineers warn that they do not restore the full seismic resistance of the original structure. A major earthquake today could cause the corroded piles to buckle, severing the supply line.
Port of Alaska Infrastructure Timeline (1915, 2026)
Period
Event
Significance
1915, 1920
Railroad Construction Dock
Established Ship Creek as a logistical hub.
1961
Modern Port Commissioned
Transition to deep-water cargo handling.
1964
Good Friday Earthquake
Port survives; consolidates state cargo traffic.
2003
Expansion Project Begins
MARAD and PND Engineers initiate Open Cell design.
2010
Construction Halted
Design failures and installation problem.
2013
Litigation Filed
Municipality sues MARAD for breach of contract.
2022
Initial Court Ruling
Judge awards Municipality $367. 4 million.
2023
PCT Completion
New Petroleum and Cement Terminal opens.
2024 (Dec)
Appeals Court Reversal
Award reduced to $11. 3 million; funding gap widens.
2026
Cargo Dock Phase
Projected start for main cargo terminal replacement.
The reliance on two primary carriers, TOTE Maritime Alaska and Matson, creates a highly rigid system. These carriers operate custom-built vessels designed to withstand the Gulf of Alaska's rough waters and the ice of Cook Inlet. TOTE's roll-on/roll-off (RO-RO) operations require specific ramp infrastructure that does not exist at alternative ports like Seward or Whittier. If the Port of Alaska were to close, diverting this volume of cargo would be logistically impossible. The road and rail connections from Seward are insufficient to handle the hundreds of containers that arrive in Anchorage twice weekly. The "just-in-time" inventory model used by Alaskan retailers means there are no warehouses full of backup stock. The supply chain is a conveyor belt; if the belt stops, the shelves go empty.
Seismic stability remains the primary engineering challenge for the new construction. The 2018 earthquake caused significant settling and damage to the backlands and the old administration building, further proving the vulnerability of the site. The new designs account for the liquefaction chance of the Bootlegger Cove clay, using piles driven up to 180 feet deep to reach stable soil. The modernization program aims to provide infrastructure with a 75-year design life, ensuring that the state's primary entrance point remains functional through the century. yet, until the cargo terminals are fully replaced, a process expected to take until the early 2030s, Alaska remains exposed to a single point of failure that could paralyze the state's economy and endanger its population.
Seismic Risks and the 2018 Point MacKenzie Earthquake
The tectonic reality of Anchorage is defined by the relentless collision of the Pacific and North American plates. Beneath the municipality, the Pacific Plate descends at a rate of approximately 40 millimeters per year, creating a subduction zone that generates of the highest seismic energy release on Earth. While the 1964 Great Alaska Earthquake remains the historical benchmark for devastation, the magnitude 7. 1 earthquake on November 30, 2018, provided a modern stress test for the city's engineering and emergency response systems. This event, centered near Point MacKenzie, exposed specific geological vulnerabilities that into 2026. The 2018 earthquake struck at 8: 29 a. m., coinciding with the morning commute and school arrivals. Unlike the 1964 event, which was a megathrust earthquake occurring at the interface between plates, the 2018 shock was an intraslab event. The rupture occurred within the subducting Pacific Plate itself, approximately 47 kilometers beneath the surface, as the plate bent and cracked under intense pressure. This depth attenuated of the surface energy, yet the shaking was violent enough to register peak ground accelerations (PGA) of up to 0. 47g in Midtown Anchorage. The mechanics of an intraslab earthquake result in high-frequency shaking that is particularly damaging to non-structural elements and brittle infrastructure. Geological composition dictates damage patterns in the Anchorage Bowl. The city sits atop the Bootlegger Cove Formation, a of glaciomarine clay deposited during the late Pleistocene. This soil is notorious for its sensitivity; under cyclic loading from seismic waves, it loses shear strength and behaves like a liquid. During the 2018 event, this liquefaction caused significant ground failure. The most visually arresting examples occurred just north of the municipality on Vine Road in Wasilla, where the pavement fractured into jagged tectonic blocks. Within Anchorage, the Minnesota Drive off-ramp collapsed, and the Seward Highway suffered severe cracking near Beluga Point. These failures confirmed that even with decades of mapping, the Bootlegger Cove clay remains a primary hazard for transportation networks. Structural performance during the 2018 earthquake validated the strict building codes implemented after 1964. Anchorage enforces local amendments to the International Building Code (IBC), requiring higher seismic resistance than other U. S. jurisdictions. Consequently, no buildings collapsed, and there were no fatalities. Yet, the definition of "failure" evolved. While skeletons of buildings held, non-structural components, ceiling grids, sprinkler systems, and partition walls, failed extensively. This internal chaos rendered structures unusable even if they remained standing. The "red tag" system, used to mark unsafe structures, was applied to dozens of homes and businesses, particularly in Eagle River where ground acceleration was amplified by local soil conditions. The Anchorage School District (ASD) bore the heaviest financial load. The earthquake caused over $150 million in damage to school facilities. Gruening Middle School and Eagle River Elementary suffered such severe structural distress that they were closed for years. At Gruening, the building's foundation settled unevenly due to soil failure, cracking concrete masonry walls and severing utility lines. The repair process involved complex retrofitting, including the installation of new micropiles to stabilize the foundations. By 2024, voters were still approving bond measures to cover the long tail of these reconstruction costs, demonstrating that the economic aftershocks of a seismic event stretch nearly a decade.
Comparison of Regional Seismic Threats
Feature
1964 Great Alaska
2018 Point MacKenzie
Castle Mountain Fault (Scenario)
Type
Megathrust (Interface)
Intraslab (Internal)
Crustal (Surface Rupture)
Magnitude
9. 2 Mw
7. 1 Mw
6. 9, 7. 3 Mw (Projected)
Depth
~25 km (Interface)
~47 km
Shallow (< 15 km)
Primary Hazard
Duration (4+ mins), Tsunami
High-frequency Shaking
Violent Local Ground Motion
Recurrence
300, 900 years
30, 50 years (Regional)
~700 years
A distinct and urgent threat lies to the north: the Castle Mountain Fault. Unlike the deep subduction faults responsible for the 1964 and 2018 events, the Castle Mountain Fault is a shallow crustal fracture that runs approximately 50 kilometers north of downtown Anchorage. Geologic studies indicate this fault generates magnitude 7. 0 earthquakes with a recurrence interval of roughly 700 years. Paleoseismic data suggests the last major rupture occurred approximately 670 years ago. This places the region in a high-probability window for a surface-rupturing event. A magnitude 7. 0 earthquake on this fault would differ fundamentally from 2018; its shallow depth would generate ground motion of much higher intensity in the Matanuska-Susitna Valley and northern Anchorage, chance exceeding the design parameters of older infrastructure. Post-2018 recovery efforts focused on increasing resilience beyond life-safety standards. The municipality expanded its seismic monitoring network, integrating data from the USArray project to create detailed shake maps that guide emergency response. Engineers also began to prioritize "functional recovery", designing buildings not just to not collapse, to remain operational after a major quake. This shift is important for hospitals, fire stations, and the Port of Alaska. The Port, which brings in 90% of the state's goods, sits on piles driven into the unstable Bootlegger Cove clay. Modernization projects through 2026 have focused heavily on stabilizing this lifeline, as a failure at the Port would sever the supply chain for the entire state. Insurance data reveals a persistent gap in financial preparedness. even with the high risk, fewer than 20% of Anchorage homeowners carry earthquake insurance, largely due to prohibitive premiums and high deductibles. The 2018 event triggered thousands of claims, yet residents paid out-of-pocket for repairs to foundations and drywall. This protection gap leaves the local economy exposed. In the event of a Castle Mountain rupture, the residential sector could face billions in uninsured losses, forcing a reliance on federal disaster aid that is frequently slow and insufficient for full recovery. The seismic narrative of Anchorage is one of adaptation. The 1964 earthquake dictated the geometry of the city, turning the slide area at Earthquake Park into a memorial rather than a neighborhood. The 2018 earthquake refined the code, exposing the weakness in non-structural elements and specific soil pockets. As of 2026, the municipality exists in a state of active defense, reinforcing its schools and port while geologists monitor the silent, accumulating on the Castle Mountain Fault. The ground beneath Anchorage is not static; it is a stored energy system waiting for the release.
Violent Crime Rates and Law Enforcement Staffing 2010, 2026
Project 80s and the Trans-Alaska Pipeline Economic Surge
Violent crime statistics in the Municipality of Anchorage between 2010 and 2026 reveal a volatile trajectory, characterized by sharp oscillations in homicide rates and a persistent, severe emergency in sexual violence. While property crime rates have occasionally fluctuated in tandem with economic conditions, violent offenses against persons have remained stubbornly high, frequently national trends. The period is marked by two distinct peaks in lethal violence: the record-breaking homicide count of 2017 and a resurgence of near-record violence in 2024. These spikes occurred against a backdrop of chronic law enforcement staffing challenges, a contentious multi-year battle over police accountability technologies, and shifting mayoral administrations attempting to the bloodshed. The year 2017 stands as the grim statistical apex for Anchorage homicides, with 38 recorded deaths. This surge was not an anomaly the culmination of rising aggregate assault rates and opioid-fueled street violence that began accelerating around 2015. Following a brief stabilization, the municipality saw violence climb again in the post-pandemic era. By the end of 2024, Anchorage recorded 34 homicides, nearly matching the 2017 record. Police data indicates that of these killings involved firearms and were frequently linked to high-risk behaviors, though domestic violence remained a constant, driving factor. The 2024 total represented a sharp increase from the 23 homicides documented in 2023, a fluctuation that law enforcement leadership attributed to a mix of interpersonal disputes and drug-related activity rather than a single organized crime syndicate. Sexual violence statistics for Anchorage present a far more entrenched and disturbing reality. Throughout the 2010, 2026 window, Alaska consistently held the highest rate of sexual assault in the United States, with Anchorage serving as the epicenter of these reports. Federal and state data frequently place the rate of forcible rape in Anchorage at three to four times the national average. In 2020, the National Institute of Justice noted that Alaska's rape incidence was "well over twice the national rate," a that widened in subsequent years. Victimization surveys suggest that even these numbers are undercounts, as survivors, particularly among Alaska Native women, do not report crimes due to deep-seated mistrust of the justice system and historical trauma. The failure to significantly reduce these rates remains a indictment of public safety strategies across multiple administrations. Law enforcement staffing levels at the Anchorage Police Department (APD) have operated in a state of precarious flux. The department has historically authorized a sworn force strength of approximately 430 to 450 officers, yet actual "boots on the ground" numbers frequently lag behind these due to attrition, retirements, and training bottlenecks. In 2021, the count of sworn officers hovered around 413. By late 2024 and early 2025, the department faced a serious retention problem, exacerbated by a competitive labor market and the Tier IV retirement benefits system, which officers as a reason for transferring to agencies in the Lower 48. To counter this, the municipality launched aggressive recruitment drives in 2025. The "Academy Class 25-1" became the largest recruit class since 2020, followed quickly by "Class 25-2" in December 2025, which added another 26 recruits. This push aimed to restore patrol density and reduce response times, which had suffered during the staffing lulls of 2022, 2024. The 2025 revised budget and the 2026 proposed budget reflected a desperate prioritization of retention, acknowledging that authorized positions mean little without qualified personnel to fill them. A defining controversy of this era was the implementation of body-worn cameras (BWC). In April 2021, Anchorage voters approved a $1. 8 million tax levy specifically to fund body cameras, signaling a clear public demand for transparency. Yet, the actual deployment of this technology faced years of bureaucratic and union-related delays. It was not until late 2023 and early 2024 that the cameras were fully rolled out to patrol officers. The need of this technology was brought into sharp focus in 2024, a year that saw a disturbing cluster of officer-involved shootings (OIS). The year 2024 witnessed eight officer-involved shootings, five of which were fatal. This "spate" of police use of deadly force was the most intense in recent memory, tying with 2016 figures. The cluster of incidents, including the fatal shooting of 16-year-old Easter Leafa in August 2024, ignited public outrage and intensified scrutiny on APD's use-of-force policies. In response, the administration of Mayor Suzanne LaFrance and Police Chief Sean Case implemented a new transparency policy in July 2024. This directive mandated the release of body camera footage within 45 days of a "serious incident," a significant shift from the previous discretionary model that allowed indefinite delays during ongoing investigations. The intersection of high violent crime and police accountability measures created a complex political environment. The Anchorage Assembly and the Mayor's office frequently clashed over the pace of reform. While the 2024 policy change on video release was a step toward transparency, the high number of OIS incidents raised questions about officer training and de-escalation tactics. An internal review released in late 2024 analyzed 15 years of police shootings, revealing that a majority of officers involved in such shootings were within their eight years of service, suggesting a correlation between experience levels and the use of lethal force. By the close of 2025, the homicide count had dipped slightly to 28, a decrease from the near-record 34 in 2024 still indicative of a violent environment well above the national average for a city of Anchorage's size. The data from 2010 to 2026 demonstrates that while specific initiatives, such as the body camera rollout or recruitment surges, can alter the mechanics of policing, the underlying drivers of violence in Anchorage remain resilient. The correlation between substance abuse, domestic violence, and lethal outcomes continues to challenge the municipality, regardless of the number of officers on patrol.
Anchorage Violent Crime and Police Use of Force Metrics (Selected Years)
Year
Total Homicides
Officer-Involved Shootings (Total)
Officer-Involved Shootings (Fatal)
Notes
2017
38
N/A
N/A
All-time record high for homicides.
2021
26
N/A
N/A
Voters approve body camera tax.
2023
23
N/A
N/A
Body camera rollout begins late in year.
2024
34
8
5
Near-record homicides; spike in police shootings.
2025
28
N/A
N/A
Recruitment surge; largest academy class since 2020.
The years 2025 and 2026 also saw a renewed focus on the "sworn to non-sworn" ratio within the department. Studies dating back to 2010 had recommended specific ratios to optimize efficiency, yet the department frequently operated with a heavy reliance on patrol overtime to cover shifts. The 2026 budget proposals sought to correct this by stabilizing the non-sworn support staff, thereby freeing up uniformed officers for direct street application. This structural adjustment was deemed necessary to address the volume of calls related to the city's homelessness emergency, which, while distinct from violent crime, frequently overlapped with police resource allocation., the period from 2010 to 2026 in Anchorage is defined by a struggle to modernize a police force facing a violent crime rate disproportionate to its population. The introduction of body cameras and the transparency policies of 2024 marked a pivot toward accountability, the stubborn persistence of homicide and sexual assault s that the municipality has yet to find a detailed solution to the violence in its communities.
Housing Inventory and Homelessness Demographics 2015, 2026
The collapse of Anchorage's housing inventory between 2015 and 2026 represents a mathematical catastrophe that fundamentally altered the municipality's demographic stability. In 2015, the city maintained a functional, if tightening, housing market. By 2024, the Anchorage Economic Development Corporation (AEDC) reported that new residential unit permits had plummeted to approximately 237, a fraction of the 500-plus annual average seen a decade prior. This stagnation occurred simultaneously with a 40% surge in single-family home prices, which breached the $514, 000 mark in 2024. The "missing middle", affordable duplexes, triplexes, and starter homes, from the market, creating a bottleneck that forced working-class residents into an increasingly predatory rental sector.
Rental vacancy rates provide the clearest metric of this suffocation. While a healthy market maintains a 5% to 7% vacancy rate to allow for mobility, Anchorage frequently operated 3% from 2021 through 2025. In specific sub-sectors, such as two-bedroom units suitable for families, vacancies dipped 2%. This scarcity drove median rents to $1, 375 by 2024, a 7. 8% year-over-year increase that far outpaced wage growth. The result was a static population of renters unable to transition to homeownership, clogging the entry-level market and pushing the most residents, those on fixed incomes or minimum wage, out of housing entirely.
The direct consequence of this inventory paralysis was a visible explosion in homelessness, characterized by a demographic rooted in the region's colonial history. Point-in-Time (PIT) counts conducted in January 2024 identified 1, 709 individuals experiencing homelessness, though service providers consistently estimated the annual "flow" of unique individuals accessing services to exceed 3, 000. The racial composition of this population remains the most damning statistic: Alaska Native and American Indian individuals comprised approximately 50% to 60% of the unhoused population, even with representing only roughly 15% of Anchorage's general census. This overrepresentation connects directly to the displacement from traditional lands and the widespread failures of rural-to-urban migration support systems dating back to the mid-20th century.
Policy decisions between 2021 and 2023 exacerbated these structural failures, culminating in the humanitarian disaster of summer 2022. The administration of Mayor Dave Bronson moved to close the Sullivan Arena, which had served as a mass emergency shelter since the onset of the COVID-19 pandemic. In June 2022, city officials directed hundreds of displaced individuals to the Centennial Campground in East Anchorage. This decision proved catastrophic. The campground absence adequate sanitation, security, or bear-proof food storage. Within weeks, the site descended into chaos; wildlife troopers were forced to kill five bears attracted to the tents, and a shootout involving police and a camper left two wounded. The "sanctioned camp" experiment demonstrated the lethal risks of substituting wilderness survival for managed shelter in an urban environment.
The mortality rate among the unhoused population reached levels in the subsequent winters. In 2023, the Anchorage Daily News and police reports confirmed 52 deaths among people living outdoors, a grim record that more than doubled the previous year's toll. The winter of 2023-2024, dubbed "Snowmageddon" due to record-breaking snowfall exceeding 100 inches, proved particularly deadly. Makeshift shelters collapsed under snow loads, and emergency warming centers were frequently at capacity. By the end of 2024, another 50 individuals had perished on the streets, cementing a two-year period where over 100 residents died due to exposure, untreated medical conditions, and violence associated with unsheltered living.
The transition to the administration of Mayor Suzanne LaFrance in mid-2024 marked a pivot toward stabilizing the shelter system, yet the structural deficit remained immense. By early 2026, the municipality focused on a decentralized method, moving away from the mega-shelter model of the Sullivan Arena toward smaller, navigation-focused centers and the conversion of hotels, such as the GuestHouse Inn, into permanent supportive housing. Even with these efforts, the fundamental math of the housing market remained broken. With construction costs remaining high due to labor absence and supply chain logistics, the private sector failed to produce the necessary volume of units to relieve pressure. Consequently, the "Allowable Camp" zones and emergency cold-weather beds remained a permanent fixture of the city's infrastructure rather than a temporary emergency measure.
The data from 2015 to 2026 reveals a municipality caught in a pincer movement: a freezing of housing production on one side and an acceleration of economic displacement on the other. The visible encampments along 3rd Avenue and the trails of the Chester Creek greenbelt were not anomalies the calculated result of a housing ecosystem that ceased to function for the bottom quartile of earners. As Anchorage method its decade, the integration of housing- policies with aggressive inventory expansion remains the only mathematically viable route to reducing the mortality rate of its most citizens.
Municipal Budget Solvency and Property Tax Revenue Trends
The financial of the Municipality of Anchorage operates within a rigidly defined "fiscal straitjacket" known as the Tax Cap, a method that has dictated the city's solvency and service levels since its inception in 1983. As of February 2026, the municipality faces a convergence of structural pressures: a credit rating under stress from administrative delays, a $1. 8 billion liability at the Port of Alaska, and a property tax system that shifts load unpredictably even as it limits total revenue.
The Anchorage Tax Cap, codified in Municipal Charter Section 14. 03 and Municipal Code 12. 25, serves as the primary governor of the city's budget. Unlike systems where revenue naturally with property values, the Anchorage cap strictly limits the total amount of property tax the municipality can collect. The formula calculates the maximum permissible tax levy based on the previous year's amount, adjusted only for the Consumer Price Index (CPI), population growth, and new construction. This design creates a zero-sum environment: when property values rise, the mill rate (tax rate) must fall to keep the total collection under the cap. Consequently, the municipality cannot capture the "upside" of a booming housing market to fund expanded services. In periods of high inflation, such as the 2022-2024 window, the cap frequently forces real-dollar budget cuts because the CPI adjustment lags behind actual cost increases for labor, fuel, and construction materials.
The limitations of this revenue model became acutely visible during the fiscal turbulence of 2024 and 2025. In July 2024, S&P Global Ratings downgraded the Municipality's general obligation (GO) debt from AA to AA-. The agency "weakened financial management practices" and a trend of negative fund balances in the general fund for fiscal years 2021 and 2022. A primary driver of this downgrade was the administrative failure to produce timely audits; the 2022 audit was released 589 days after the fiscal year ended, a delay that blinded decision-makers to the city's true cash position. By mid-2025, Fitch Ratings also revised its outlook to negative, affirming the AA rating warning that continued "tardy audits" and diminished financial resilience could trigger further downgrades. These ratings are not abstract scores; they directly increase the cost of borrowing for taxpayers, adding millions in interest payments to bond measures.
The "negative fund balance" emergency of 2024, where the city's reserves dipped zero, was not a result of spending exceeding the budget in the traditional sense, rather a liquidity crunch exacerbated by unbooked federal reimbursements and the 2018 earthquake costs. By the 2025 budget pattern, Mayor Suzanne LaFrance's administration prioritized rebuilding these reserves, a process expected to take multiple years. The 2025 budget, approved at approximately $636 million, remained under the tax cap required aggressive maneuvering to fund core services. Specifically, the administration allocated significant new funding to snow removal operations, purchasing $3. 75 million in new heavy equipment in late 2024, after the disastrous winters of 2022-2023 and 2023-2024 exposed the inadequacy of the existing fleet. The cost of climate adaptation has thus become a direct line item, competing for space under the cap.
Property tax assessments remain the most contentious touchpoint for residents. In January 2026, the Municipality released new property assessments that triggered immediate backlash. While the in total increase across the Anchorage Bowl was approximately 4%, specific neighborhoods saw valuations spike by up to 40% due to changes in appraisal methodology and market consolidation. This volatility forced the Mayor to order an immediate review of "unusually high" increases in February 2026. Under the tax cap, these spikes do not generate more total revenue for the city; instead, they redistribute the tax load. Homeowners in rapidly appreciating neighborhoods pay a larger slice of the fixed pie, while those with stagnant values pay less. This frequently pits neighborhoods against one another, as the "tax shift" creates winners and losers without improving municipal solvency.
Beyond the general fund, the Port of Alaska represents the single largest financial liability in the municipality's history. The Port of Alaska Modernization Program (PAMP), with a total estimated cost exceeding $1. 7 billion, is serious for the state's food and fuel security. After years of piecemeal funding, the Anchorage Assembly took decisive action in April 2025, approving a massive $1. 1 billion revenue bond to finance the construction of new cargo terminals. Unlike general obligation bonds, which are paid by property taxes, these revenue bonds are repaid through port tariffs. This financing structure shifts the cost from Anchorage property owners to all Alaskan consumers, as freight surcharges, projected to rise to nearly $4. 80 per ton, are passed down in the price of groceries, gasoline, and construction materials. The start of major cargo terminal construction in 2026 marks the point of no return for this debt.
Attempts to diversify revenue away from property taxes have yielded mixed results. The 5% retail tax on alcohol, approved by voters in 2020 (Proposition 13), generates approximately $15 million annually. While sold to voters as a means to fund new services for homelessness, substance misuse, and public safety, a 2025 analysis revealed that nearly 80% of these funds were used to backfill lost state and federal grants. The "new" revenue stream became a life raft to maintain existing service levels rather than an expansion of capacity. Similarly, the marijuana sales tax and the hotel bed tax provide auxiliary revenue, neither generates enough volume to offset the structural limitations of the property tax cap or the decline in State of Alaska revenue sharing.
The relationship between the Municipality and the State of Alaska further complicates the budget. For decades, the state provided strong revenue sharing and paid of school bond debt. Since 2015, state support has eroded, transferring costs to the local level. In 2022, the state briefly fully funded school bond debt reimbursement, a rare reprieve, the long-term trend is one of state withdrawal. This "fiscal gap" forces the municipality to shoulder costs for education, prosecution, and road maintenance that were previously shared. The 2025 budget process highlighted this, as the Anchorage School District faced a $100 million deficit, forcing it to deplete emergency savings and cut programs, which indirectly pressures the municipal budget to maximize its local contribution to education.
As of early 2026, the Municipality of Anchorage remains solvent fragile. The immediate liquidity emergency of 2024 has stabilized, and the 2025 budget successfully incorporated higher labor costs and snow removal investments. Yet, the underlying structural problems. The tax cap prevents revenue from keeping pace with the true cost of service delivery in an inflationary environment. The reliance on a single major asset, the Port, creates a concentration of risk, and the credit rating downgrade has raised the cost of capital. The city's financial health depends entirely on the successful execution of the Port modernization without cost overruns and the restoration of administrative capacity to produce timely financial data.
Table 12. 1: Municipality of Anchorage Key Financial Indicators (2023-2026)
Why it matters: Private military contractors are increasingly shaping conflicts in Africa, blurring the lines between war and crime. Russia's Wagner Group, functioning as an unofficial arm of…
What do we know about Dena'ina Ełnena and Early European Contact?
Long before the surveyor's stake pierced the ground at Ship Creek, the Anchorage basin functioned as a strategic node within Dena'ina Ełnena, the traditional territory of the Dena'ina Athabascan people. Unlike the emptiness frequently depicted in colonial narratives, this region supported a complex network of seasonal villages and subsistence sites.
What do we know about Alaska Railroad Construction and the Ship Creek Tent City?
The genesis of modern Anchorage was not an organic settlement pattern a calculated federal industrial maneuver. On March 12, 1914, the United States Congress passed the Alaska Railroad Act, authorizing the construction of a rail line from the Pacific coast to the interior.
What do we know about Strategic Military Expansion and JBER Consolidation?
The transformation of Anchorage from a railroad tent city into a strategic garrison began not with gradual settlement, with a singular, urgent directive in 1940. As war loomed in the Pacific, the War Department recognized Alaska as the "Air Crossroads of the World," a realization that General Simon Bolivar Buckner Jr.
What do we know about Good Friday Earthquake and Urban Redevelopment?
At 5: 36 PM on Good Friday, March 27, 1964, the subduction zone between the Pacific and North American plates ruptured twenty miles beneath Prince William Sound. The resulting magnitude 9.
What do we know about Project 80s and the Trans-Alaska Pipeline Economic Surge?
The completion of the Trans-Alaska Pipeline System (TAPS) in 1977 did not alter the economic trajectory of Anchorage; it severed the city from its modest past and injected a volatile, high-pressure stream of petrodollars directly into the municipal bloodstream. For the half of the 20th century, Anchorage had functioned as a railroad camp and a military outpost, dependent on federal appropriations.
What do we know about City-Borough Unification and Home Rule Charter?
By the early 1970s, the Anchorage basin suffered from a severe case of administrative schizophrenia. Two distinct local governments, the City of Anchorage (incorporated 1920) and the Greater Anchorage Area Borough (GAAB, established 1964), operated with overlapping jurisdictions, conflicting ordinances, and a penchant for litigation against one another.
What do we know about Ted Stevens Anchorage International Airport Cargo Logistics?
The physics of aviation dictate the economic reality of Ted Stevens Anchorage International Airport (ANC). Located at 61 degrees North, the airport sits within 9.
What do we know about Port of Alaska Infrastructure Stability and Supply Chain Reliance?
The Port of Alaska, formerly known as the Port of Anchorage, functions as the single most significant logistical choke point in the state. While the Municipality of Anchorage manages the facility, its operational reach dictates the survival of nearly 90 percent of the Alaska population.
What do we know about Seismic Risks and the Point MacKenzie Earthquake?
The tectonic reality of Anchorage is defined by the relentless collision of the Pacific and North American plates. Beneath the municipality, the Pacific Plate descends at a rate of approximately 40 millimeters per year, creating a subduction zone that generates of the highest seismic energy release on Earth.
What do we know about Violent Crime Rates and Law Enforcement Staffing?
Violent crime statistics in the Municipality of Anchorage between 2010 and 2026 reveal a volatile trajectory, characterized by sharp oscillations in homicide rates and a persistent, severe emergency in sexual violence. While property crime rates have occasionally fluctuated in tandem with economic conditions, violent offenses against persons have remained stubbornly high, frequently national trends.
What do we know about Housing Inventory and Homelessness Demographics?
The collapse of Anchorage's housing inventory between 2015 and 2026 represents a mathematical catastrophe that fundamentally altered the municipality's demographic stability. In 2015, the city maintained a functional, if tightening, housing market.
What do we know about Municipal Budget Solvency and Property Tax Revenue Trends?
The financial of the Municipality of Anchorage operates within a rigidly defined "fiscal straitjacket" known as the Tax Cap, a method that has dictated the city's solvency and service levels since its inception in 1983. As of February 2026, the municipality faces a convergence of structural pressures: a credit rating under stress from administrative delays, a $1.
Why it matters: Digital lending in Kenya boomed from 2020 to 2025, promising financial freedom but trapping vulnerable citizens in cycles of debt. The unregulated digital credit marketplace…
Why it matters: Renewable energy subsidies are crucial for shaping global energy production and mitigating climate change impacts. The allocation of subsidies involves a complex process influenced by…
Why it matters: The delivery platform industry saw significant growth in 2023, driven by demand for convenience and digital services. Key players like DoorDash, Uber Eats, Grubhub, and…
Why it matters: Subscription traps are a growing financial burden affecting millions of consumers globally. Dark patterns, deceptive design techniques, play a key role in perpetuating these traps…
Why it matters: Banks globally have raised standard consumer-account fees in unison, leading to suspicions of collusion. Regulators in multiple countries are investigating whether major banks are coordinating…
Why it matters: The 'Honour Killing Belt' in India has seen a surge in murders justified as protecting family honor. This report explores the roots of these crimes,…
Get updates on this place
Get verified alerts when this file is updated (verification required).