Verified Against Public And Audited RecordsLast Updated On: 2026-02-26
Reading time: ~52 min
File ID: EHGN-PLACE-33237
Investigative Bio of New York City Subway
Steam Power and Pneumatic Tube Prototypes (1869, 1899)
The genesis of New York City's subway system lies not in the successful opening of 1904, in a series of daring, dangerous, and frequently bizarre Victorian experiments that predated it by thirty-five years. Between 1869 and 1899, the city oscillated between the allure of pneumatic propulsion and the grimy reality of steam-powered elevated trains. This era defined the engineering constraints and political battles that would shape the future underground network.
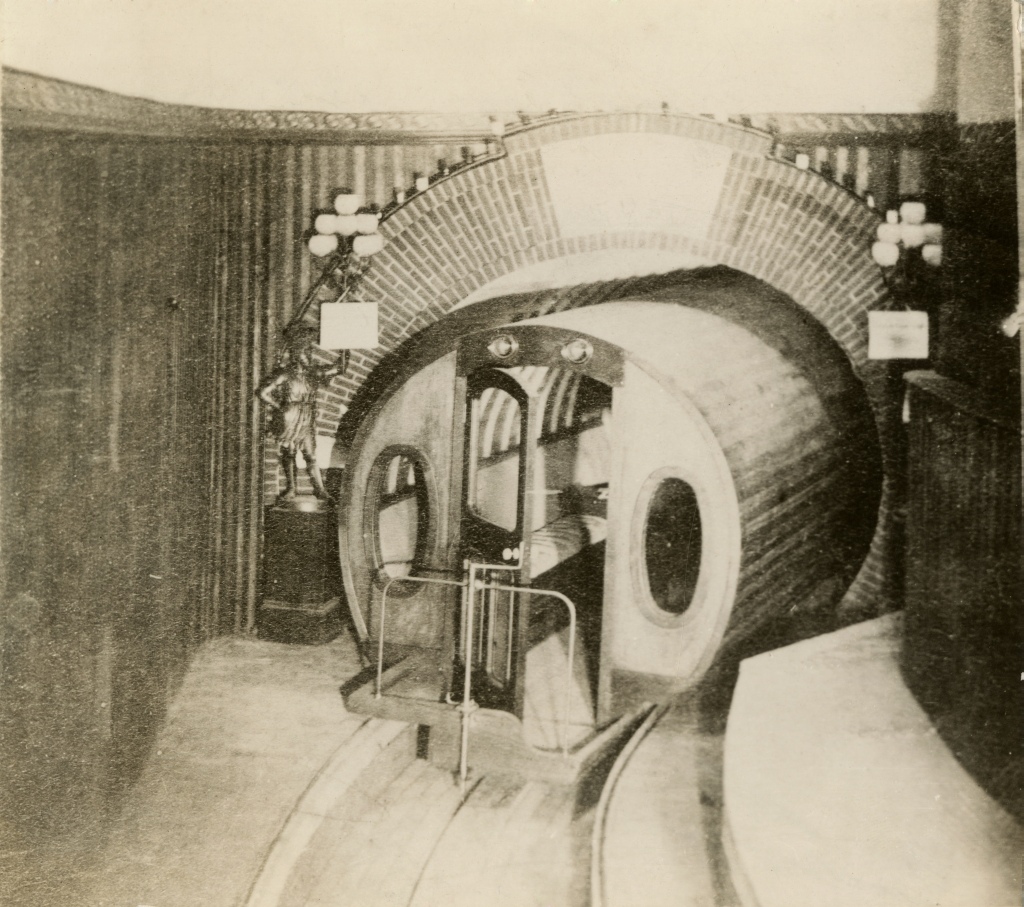
In 1869, Alfred Ely Beach, the publisher of Scientific American, began the secret construction of the Beach Pneumatic Transit line. To evade the corrupt Tammany Hall machine led by William "Boss" Tweed, who controlled streetcar franchises, Beach obtained a permit for a pneumatic mail dispatch system. Under the cover of night, his team excavated a tunnel beneath Broadway, extending 312 feet from Warren Street to Murray Street. The tunnel, eight feet in diameter, was lined with brick and shaped by a hydraulic shield, a technological innovation that allowed workers to bore through the sandy soil without disturbing the street surface above.
The system opened to the public on February 26, 1870. It featured a single wooden car, sixteen feet long, capable of seating twenty-two passengers. Propulsion came from a massive 48-ton Roots blower, nicknamed "the Western Tornado," located in the basement of the station. This rotary fan generated enough air pressure to push the car down the track at speeds of up to ten miles per hour. When the car reached the end of the line, the blower reversed, creating a vacuum that sucked the vehicle back to the station. In its year, the line carried 400, 000 passengers, who paid twenty-five cents to experience the clean, smokeless travel. Even with this popular success, the Panic of 1873 and sustained political opposition forced the tunnel's closure. The prototype remained sealed until 1912, when workers excavating the BMT Broadway Line cut into the old tube, finding the rotting car still on its tracks.
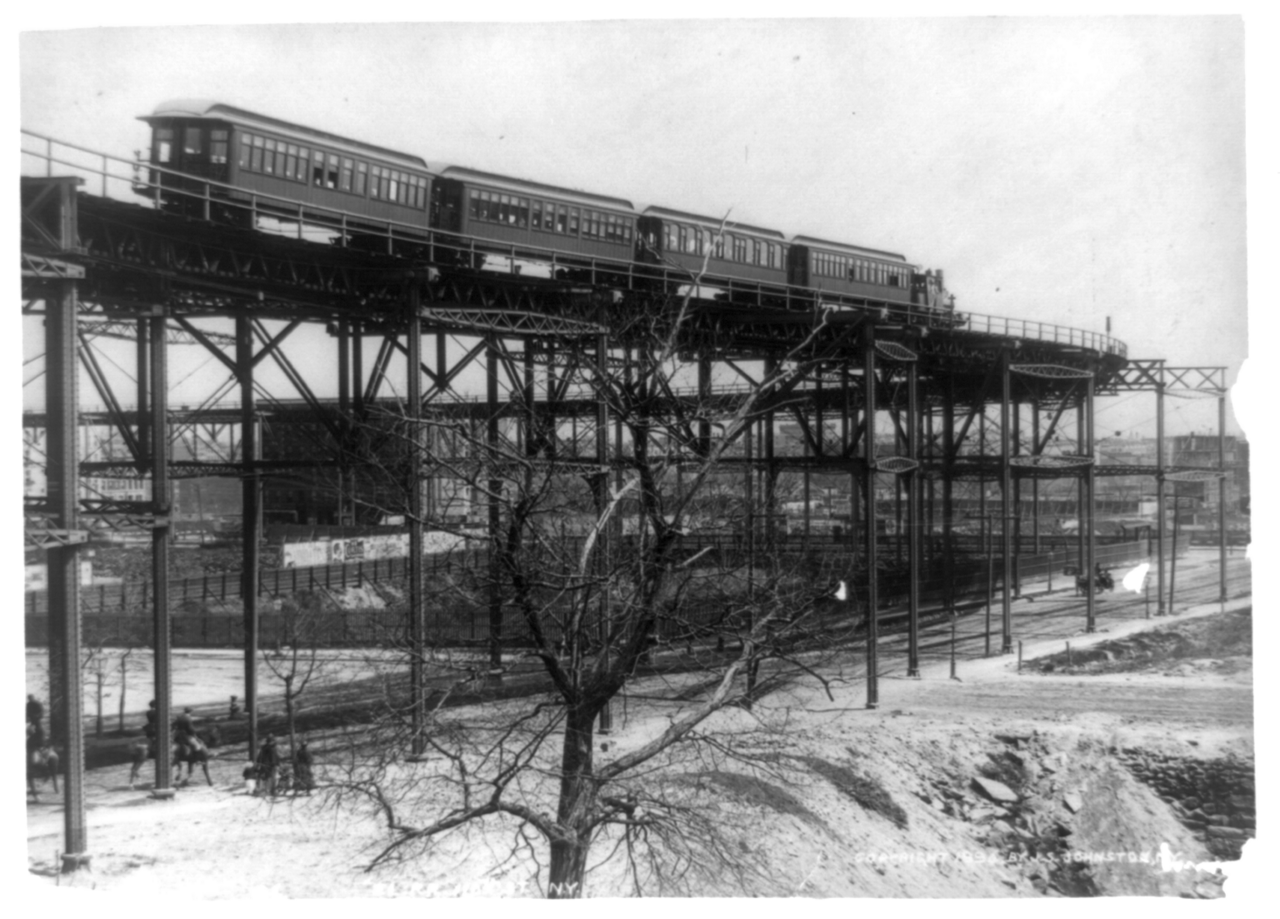
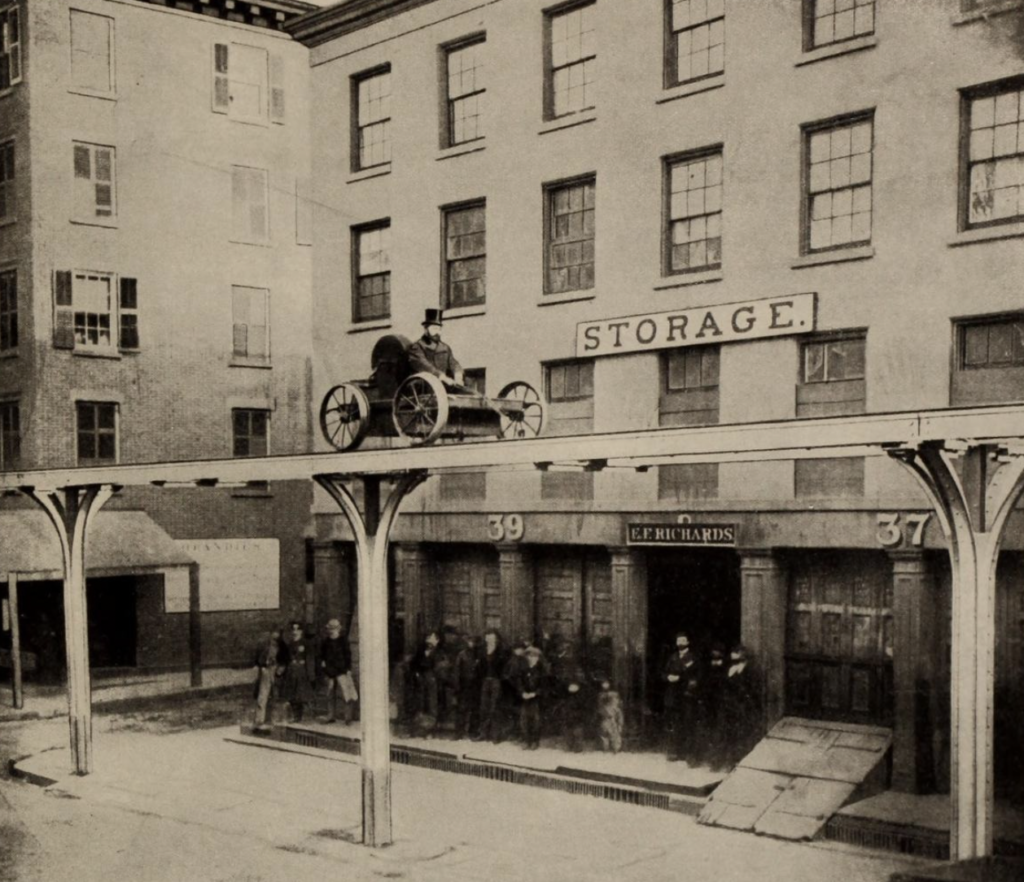
While Beach experimented underground, the city turned its eyes upward. The West Side and Yonkers Patent Railway, the city's elevated line, began operations on Greenwich Street in 1868. Initially, it used a cable-driven system powered by stationary steam engines spaced along the route. The technology proved disastrously unreliable; the cables frequently snapped, and the "claws" used to grip the cable caused a jerky, violent ride. In one notorious test run, a car carrying three officials derailed and fell to the street; remarkably, the occupants survived. By 1871, the cable system was abandoned in favor of small steam locomotives, marking the true beginning of the "El" era.
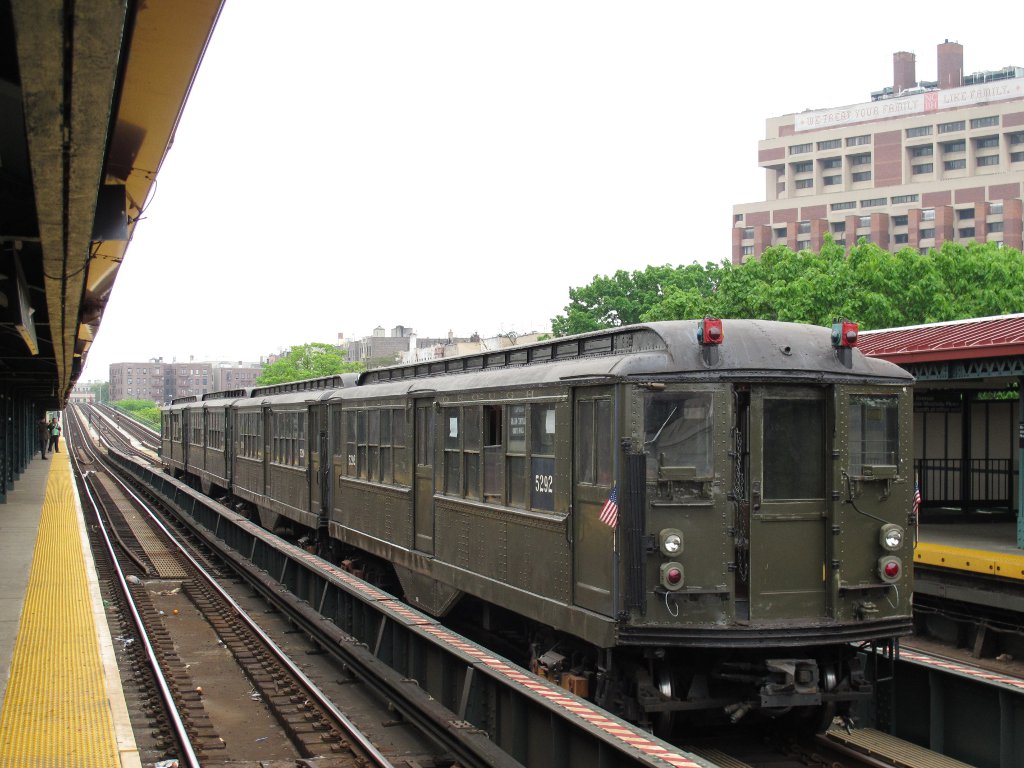
For the three decades, steam locomotives dominated New York's rapid transit. The Manhattan Railway Company consolidated the lines, running 0-4-4T "Forney" locomotives that became the workhorses of the system. These engines, while, turned the avenues into dark, noisy, and dirty corridors. They consumed vast quantities of coal and water, spewing ash, oil, and cinders onto pedestrians. A report from 1890 indicated that these locomotives burned approximately 45 pounds of coal per mile. The pollution and noise led to constant lawsuits and public outcry, yet the elevated lines remained the only viable rapid transit option for a rapidly densifying metropolis.
The turning point for underground transit came with the Great Blizzard of 1888. From March 11 to 14, a ferocious nor'easter dumped up to 50 inches of snow on the region, paralyzing the city. Winds reached 85 miles per hour, snapping telegraph and telephone poles and freezing the elevated trains to their tracks. Thousands of commuters were stranded, and the city's commerce ground to a halt. The disaster exposed the extreme vulnerability of above-ground infrastructure. In the aftermath, civic leaders and the public demanded a transit system immune to the elements. The blizzard provided the political capital necessary to push for burying utility wires and, crucially, building a subway.
Legislative action followed the meteorological emergency. In 1894, the state legislature passed the Rapid Transit Act, a landmark piece of legislation that fundamentally altered the ownership model of New York's transit. Unlike the private franchises of the elevated lines, this act proposed municipal ownership. The city would pay for the construction of the subway, while a private company would lease and operate it. This "city-built, private-operated" model was put to a public referendum in November 1894. The voters approved the measure by a margin of more than three to one, signaling a definitive end to the era of hesitation. The vote set the stage for the heavy engineering work that would begin at the turn of the century, realizing the vision that Alfred Ely Beach had briefly illuminated in his short, wind-blown tunnel.
Comparison of Early NYC Rapid Transit Prototypes (1869, 1899)
System Name
Operational Dates
Propulsion Method
Key Metric
Fate
Beach Pneumatic Transit
1870, 1873
Pneumatic (48-ton Roots Blower)
400, 000 passengers (1st year)
Closed due to politics/finance; sealed in tunnel.
West Side & Yonkers Patent Ry.
1868, 1870
Cable / Stationary Steam
15 mph top speed (theoretical)
Failed reliability; converted to locomotive steam.
Manhattan Railway Co. (Els)
1871, 1900s (Steam era)
Steam Locomotives (Forney 0-4-4T)
45 lbs coal burned per mile
Electrified starting 1900; lines eventually demolished.
Contract One Financing and the Interborough Rapid Transit Monopoly (1900, 1904)
Steam Power and Pneumatic Tube Prototypes (1869, 1899)
The realization of New York's underground transit system began not with a shovel, with a poker game of high finance. On January 15, 1900, the Rapid Transit Commission opened bids for the "Contract One" project, a massive undertaking to build a subway from City Hall to the Bronx. The winning bid of $35 million came from John B. McDonald, a contractor with strong ties to Tammany Hall insufficient capital to back his ambition. The city required a $6 million surety bond to guarantee construction and operation, a sum McDonald did not possess. The project stood on the precipice of failure until August Belmont Jr., a financier and horse-racing tycoon, intervened. Belmont did not enter the fray to save the city's transit dreams; he entered to own them. He provided the necessary backing, establishing the Rapid Transit Subway Construction Company to execute the work, making McDonald his employee.
The financial architecture of Contract One established a precedent that would haunt the city for a century. Under the terms, the City of New York issued bonds to pay for the physical construction of the tunnels and stations, retaining ownership of the infrastructure. yet, Belmont's company was granted a fifty-year operating lease, tax-exempt, with a twenty-five-year renewal option. The private entity was responsible only for the "equipment", the rolling stock, signals, and power plant. This arrangement socialized the risk of the expensive excavation while privatizing the profits of the farebox. Belmont understood that while the tunnel was a fixed cost, the nickel fares from a growing population represented an infinite revenue stream. In April 1902, he incorporated the Interborough Rapid Transit Company (IRT) to take over the operating lease, capitalizing the new entity at $25 million.
Construction began on March 24, 1900, under the direction of Chief Engineer William Barclay Parsons. Parsons rejected the deep-tube methods used in London, which required elevators and extensive ventilation. Instead, he chose the "cut-and-cover" method, a brutal engineering strategy that involved tearing open the streets from the surface, laying the track, and covering it back up. For four years, Manhattan became a canyon of timber and mud. The process required the relocation of a labyrinth of sewer pipes, gas mains, and pneumatic tubes. It was a violent surgery on the city's grid, performed without anesthesia. Residents navigated wooden planks over gaping chasms, and the noise of steam drills became the city's constant soundtrack.
The haste to complete the project led to catastrophic negligence. On January 27, 1902, a supply of dynamite stored in a wooden shed at Park Avenue and 41st Street detonated. The blast was not a minor construction mishap; it was a scene of war. The explosion tore through the Murray Hill Hotel and the Grand Union Hotel, shattering windows for blocks and raining debris upon the street. Six people died, and hundreds suffered injuries. The subcontractor responsible, Ira Shaler, had stored excessive explosives in a residential zone to speed up the excavation of the tunnel toward Grand Central. Shaler was indicted died in June 1902, crushed by falling rock in the very tunnel he was building. The accident exposed the complete absence of safety, yet the Rapid Transit Commission pressed forward, driven by the political need of opening the line before the election pattern.
As the physical rails took shape, Belmont moved to secure his monopoly. The primary competition to the subway was the Manhattan Railway Company, which controlled the four elevated lines (the Second, Third, Sixth, and Ninth Avenue Els) that darkened the city's avenues. These steam-powered lines moved millions were despised for their smoke and noise. Belmont knew that if the Els lowered their fares or electrified, they could undercut his subway. In a ruthless corporate maneuver, the IRT leased the Manhattan Railway Company for 999 years, April 1, 1903. This acquisition gave the IRT total control over rapid transit in Manhattan and the Bronx. Belmont owned the tracks above and the ground, ensuring that no competitor could challenge his five-cent fare empire.
To power this new subterranean network, the IRT constructed a massive powerhouse at 59th Street and the Hudson River. Designed by McKim, Mead & White, the architects of the original Pennsylvania Station, the structure resembled a Roman temple dedicated to the god of electricity. Inside, fifty-four coal-fed boilers generated the 11, 000 volts needed to propel the trains. This centralization of power was a technical marvel also a point of vulnerability; the entire system relied on the steady burning of coal at a single location on the waterfront.
The system officially opened on October 27, 1904. Mayor George B. McClellan Jr., son of the Civil War general, used a silver controller to drive the train from City Hall station. The ceremony was a carefully orchestrated pageant of civic pride, the reality on the platforms was chaotic. The IRT had underestimated the public's demand. By the evening rush, over 150, 000 people had crammed into the system. The "City Hall Loop," a curved station designed as the system's jewel with Guastavino tile arches and chandeliers, proved immediately dysfunctional for heavy crowds due to the dangerous gap between the train doors and the curved platform. It was a triumph of aesthetics over utility, a signature of the Belmont era.
The initial line ran from City Hall, north under Lafayette Street and Fourth Avenue to Grand Central, then west across 42nd Street to Times Square, and north up Broadway to 145th Street. This "Z" shaped route served the commercial interests of the day created a bottleneck at 42nd Street that would plague the system for decades. The 42nd Street Shuttle exists today as a fossil of this original alignment. The decision to route the main line across 42nd Street was not a transit decision; it was a real estate play, cementing the area as the new commercial heart of the city, shifting the center of away from lower Manhattan.
By the end of 1904, the IRT was a financial juggernaut. The five-cent fare, written into Contract One, seemed like a license to print money in an era of deflation. Belmont and his investors saw returns that far exceeded the bond interest the city paid on the construction debt. The public, yet, quickly soured on the "Interborough." The trains were crowded, the guards were aggressive, and the monopoly was unresponsive to complaints. The "straphanger", a term coined for riders who had to stand and hold onto leather straps, became a symbol of the city's endurance. The subway was faster than the streetcar and cleaner than the El, it was not the comfortable ride Belmont had promised in his private car, the "Mineola."
The success of Contract One set the stage for the expansion wars that would follow. The city realized too late that it had signed away its use for fifty years. The monopoly held by the IRT meant that any new lines would have to be negotiated on Belmont's terms, or the city would have to find a new partner. This tension between the private profit motive and the public need for expansion would define the decade of transit planning, leading eventually to the Dual Contracts of 1913. in 1904, August Belmont Jr. stood alone as the king of New York's underground, having turned a $35 million municipal risk into a private fortune.
Dual Contracts Expansion and Fare Cap Economics (1913, 1940)
On March 19, 1913, New York City officials and private transit magnates gathered to sign the Dual Contracts, a set of agreements that would double the size of the rapid transit network and destroy the private companies that operated it. This deal, valued at roughly $337 million (equivalent to over $10 billion in 2026), remains one of the largest public works undertakings in human history. The contracts mandated that the Interborough Rapid Transit Company (IRT) and the Brooklyn Rapid Transit Company (BRT) expand their lines into the outer boroughs, facilitating a population explosion in the Bronx, Queens, and Brooklyn. In exchange, the city provided capital and guaranteed the companies "preferential" returns on their investment. Yet, buried within the legal text was a stipulation that would doom the operators: the fare was legally capped at five cents for the entire forty-nine-year lease.
The physical transformation of the city began immediately. Engineers shattered the original "Z" formation of the subway, which forced riders to detour across 42nd Street, and replaced it with the "H" system in 1918. This configuration created the modern layout of parallel trunk lines along Seventh and Lexington Avenues. The construction process was chaotic and deadly; streets were ripped open for cut-and-cover tunneling, destabilizing building foundations and disrupting the daily life of millions. The city's population surged outward along these new steel arteries, turning farmland in the Bronx and semi-rural tracts in Brooklyn into dense urban corridors almost overnight.
Economic reality struck the private operators with the outbreak of World War I. The conflict triggered hyperinflation that doubled the cost of labor, coal, and steel between 1914 and 1918. The nickel fare, which had been a source of immense profit in 1904, became a financial noose. While the cost of moving a passenger rose to nearly six cents, the IRT and BRT were legally forbidden from charging more than five. The companies deferred maintenance, cut wages, and resisted safety upgrades to stay solvent. This financial starvation directly contributed to the system's deadliest disaster.
On November 1, 1918, the BRT's financial desperation and labor hostility culminated in the Malbone Street Wreck. The Brotherhood of Locomotive Engineers had gone on strike to demand higher wages, and the BRT, refusing to negotiate, staffed trains with inexperienced strikebreakers. Edward Luciano, a twenty-three-year-old crew dispatcher with only two hours of classroom training and no experience on the Brighton Beach line, was ordered to operate a rush-hour train. Speeding at nearly forty miles per hour into a six-mile-per-hour curve beneath Malbone Street, the wooden cars derailed and disintegrated against the tunnel walls. At least ninety-three people died. The crash destroyed the BRT's reputation and forced it into receivership, emerging later as the Brooklyn-Manhattan Transit Corporation (BMT).
The political backlash against the "traction interests" found its champion in John F. Hylan, elected mayor in 1917. Hylan, a former BRT motorman who had been fired for operating a train recklessly, harbored a personal vendetta against the private transit monopolies. He viewed the IRT and BMT not as partners as parasites. Hylan blocked every attempt by the companies to raise the fare, preferring to let them bleed cash rather than grant them a political victory. His administration refused to approve new routes for the private lines, creating a deliberate stagnation in service expansion even as ridership numbers.
Hylan's solution was the Independent Subway System (IND), a municipally owned and operated network designed to compete with, rather than complement, the private lines. Planning began in the 1920s with a mandate to drive the private operators out of business. The IND lines, such as the Eighth Avenue line (opened in 1932), were over-engineered with flying junctions and massive station complexes, costing significantly more per mile than previous lines. The city built these routes parallel to existing elevated lines, intentionally siphoning passengers away from the IRT and BMT. The IND was the subway system built entirely with public funds, signaling a shift toward the concept of transit as a subsidized public service rather than a profitable enterprise.
The Great Depression delivered the final blow to the private operators. Ridership plateaued as unemployment soared, and the rigid five-cent fare made it impossible to service the debt accumulated during the expansion of the Dual Contracts. The IRT went into receivership in 1932, unable to pay the city its share of the revenue or cover its bond obligations. The BMT, though more with its rolling stock and operations, could not escape the mathematical certainty of the fare cap. By the late 1930s, both companies were essentially operating as wards of the state, their infrastructure crumbling under the weight of deferred maintenance.
Unification arrived in June 1940, ending the era of private subway operation in New York. The City of New York purchased the bankrupt assets of the IRT and BMT for approximately $326 million, a sum that retired the companies' debt left the city with a massive rehabilitation bill. The three systems, IRT, BMT, and IND, were consolidated under municipal control. The unification did not immediately solve the system's problems; instead, it transferred the financial load entirely to the taxpayer. The five-cent fare remained politically sacrosanct until 1948, forcing the city to subsidize every ride for another decade while the physical plant continued to deteriorate.
Transit Consolidation Metrics (1913, 1940)
Metric
1913 (Dual Contracts Era Start)
1940 (Unification)
System Ownership
Private Duopoly (IRT, BRT)
100% Municipal (NYC Board of Transportation)
Track Mileage
~296 miles
~630+ miles (including IND)
Base Fare
5 cents ($1. 53 adj. 2024)
5 cents ($1. 10 adj. 2024)
Operator Status
Highly Profitable
Bankrupt / Receivership
Key Infrastructure
Original Z-System
H-System, Steinway & Montague Tunnels
The legacy of this period is a system built on a financial paradox: the Dual Contracts successfully dispersed the population and created the modern metropolis, yet the economic model underpinning that expansion failed completely. The refusal to index the fare to inflation created a culture of deferred maintenance that plagues the Metropolitan Transportation Authority to this day. The "nickel fare" was not a price; it was a political weapon that destroyed the private transit industry and birthed the massive, debt-ridden public authority model that currently governs New York's underground.
Municipal Unification and the Independent Subway System (1932, 1953)
Contract One Financing and the Interborough Rapid Transit Monopoly (1900, 1904)
The Independent Subway System (IND) opened its doors at midnight on September 10, 1932, not as a transit line, as an act of municipal warfare. Mayor John F. Hylan, a former motorman fired by the Brooklyn Rapid Transit Company (BRT) for operating a train too fast around a curve, harbored a lifelong vendetta against the private "traction trusts." His administration designed the IND to duplicate and destroy the existing private lines. The segment, the Eighth Avenue Line running from 207th Street to Chambers Street, was an over-engineered of transit: 14 miles of track, 30 stations, and platforms stretching 660 feet to accommodate 11-car trains. It consumed 150, 000 tons of steel and 1 million cubic yards of concrete. Unlike the ornate mosaics of the IRT or the utilitarian steel of the BMT, the IND stations were austere, tiled in color-coded bands to help travelers navigate without reading signs, a functionalist aesthetic for a system built to run the competition into the ground. The Great Depression, arriving just as the IND began construction, paradoxically aided its completion while dooming its future expansion. Labor was cheap, and federal New Deal funds kept the tunnel shields moving. Yet the economic collapse obliterated the "Second System," a grandiose 1929 plan to build 100 miles of new routes, including a Second Avenue Subway and a line to Staten Island. Ghost stations, such as the cavernous, trackless shell at South 4th Street in Brooklyn, remain sealed beneath the pavement today, concrete monuments to a network that ran out of money before it could lay a single rail. By 1940, Hylan's strategy of strangulation succeeded. The private companies, battered by the Depression and locked into a five-cent fare mandated by the 1913 Dual Contracts, collapsed into the city's arms. On June 12, 1940, the City of New York finalized the purchase of the Interborough Rapid Transit (IRT) and the Brooklyn-Manhattan Transit (BMT) for $326 million. This unification ended the era of private subway ownership. The city controlled every mile of rapid transit, inheriting a sprawling, disjointed network of three incompatible divisions (IRT, BMT, IND) and a mountain of deferred maintenance. The immediate result was the closure of the "redundant" elevated lines, including the Ninth Avenue El, which the city tore down to boost property values and scrap metal yields, stripping the West Side of transit options that the IND was meant to replace. World War II halted all hopes of integrating these systems. As gasoline rationing forced automobiles off the road, New Yorkers flooded into the subway. Ridership surged to astronomical levels, hitting an all-time annual peak of 2. 067 billion passengers in 1946. On a single day, December 23, 1946, the turnstiles registered 8. 8 million fares. The system was operating at absolute capacity, punishing the infrastructure. Tracks, signals, and cars, already aging from the financial starvation of the 1930s, were ground down by the relentless 24-hour crush. Maintenance was impossible; the trains had to keep moving to transport the wartime workforce. The post-war era brought a reckoning. The five-cent fare, sacrosanct since 1904, could no longer cover the operating costs of a system ravaged by overuse and inflation. For decades, politicians had won elections by pledging to defend the nickel fare, treating it as a birthright of the New York worker. the deficit was a mathematical reality that demagoguery could not erase. In 1948, Mayor William O'Dwyer expended his political capital to double the fare to ten cents. The hike sparked outrage failed to the financial bleeding. The revenue generated was immediately swallowed by wage increases and the desperate need to replace rolling stock that dated back to World War I. By 1953, the subway had become a toxic political liability. No mayor wanted to be the face of the fare hike or the inevitable service cuts. The solution was to divorce the subway from direct municipal control. On June 15, 1953, the state legislature created the New York City Transit Authority (NYCTA), a public benefit corporation designed to operate the system on a business basis. The Authority's mandate was to pay its own way from farebox revenue, a directive that led immediately to the fare rising to 15 cents. This transition marked the end of the subway as a direct arm of city government and the beginning of the token era. To manage the new 15-cent price, the Authority introduced the brass subway token, a coin that would become the currency of the city for the 50 years. The creation of the NYCTA shielded City Hall from voter wrath the transit network from the city's capital budget, setting the stage for a pattern of disinvestment. The unification that was supposed to create a direct, world-class network had instead produced a cash-strapped giant, drifting toward the precipice of the fiscal emergency that would define the coming decades.
NYC Subway System Milestones (1932, 1953)
Date
Event
Significance
Sep 10, 1932
IND Eighth Avenue Line Opens
city-owned subway line; start of the IND system.
June 1940
Municipal Unification
City purchases IRT and BMT for $326 million; private operation ends.
Dec 23, 1946
Daily Ridership Record
8. 8 million passengers in a single day; system pushed to limit.
July 1, 1948
Fare Hike
Fare doubles from 5 cents to 10 cents, ending 44 years of the nickel fare.
June 15, 1953
NYCTA Created
Transit operations removed from direct mayoral control; fare rises to 15 cents.
Deferred Maintenance Costs and the 1975 Fiscal Insolvency
The fiscal collapse of New York City in 1975 stands as the single most destructive event in the history of the subway, initiating a period of physical decay that nearly destroyed the network. While the popular narrative focuses on President Gerald Ford's refusal to provide a federal bailout, the specific engineering consequences of the emergency were far more damaging than the political theater. Facing a $3. 3 billion deficit and unable to borrow from credit markets, Mayor Abraham Beame and the Emergency Financial Control Board made a calculated decision to cannibalize the transit system's capital budget to pay for daily operations. Funds for rail replacement, signal upgrades, and structural repairs were diverted to cover salaries and electricity. This policy, known clinically as "deferred maintenance," was in reality a systematic asset liquidation that operated on a delay; the money saved in 1975 resulted in catastrophic infrastructure failures by 1980.
The metrics of this decline reveal a system in freefall. The primary indicator of subway reliability is the Mean Distance Between Failures (MDBF), which measures how far a train travels before a mechanical breakdown causes a delay. In 1977, even after two years of austerity, the MDBF stood at approximately 13, 900 miles. As the backlog of unperformed maintenance compounded, this figure collapsed. By 1981, the MDBF had plummeted to 6, 639 miles. Trains were breaking down twice as frequently, stranding passengers in dark tunnels and creating effects that paralyzed the entire network. This statistical drop correlated directly with the cessation of preventative care; components were no longer replaced on a schedule only after they had failed in service.
Track conditions to a point where safety could no longer be guaranteed at normal speeds. The Transit Authority instituted "red tag" zones, sections of track where rails were so corroded or loose that train operators were forced to reduce speed to 10 miles per hour to prevent derailment. By 1984, the system contained over 450 red tag zones, turning express runs into agonizingly slow crawls. The deferred replacement of track geometry meant that the physical alignment of the rails warped, causing a violent, side-to-side motion known as "hunting" that damaged wheel trucks and further eroded the rails. In 1980 alone, the system suffered 30 derailments, a safety failure rate that would be unacceptable in any modern transit environment.
The visual disintegration of the subway during this era was not an aesthetic problem a symptom of the collapse in security and maintenance. The "graffiti epidemic" that coated every car in spray paint was possible only because the Transit Authority could not afford to secure its train yards or repair its car wash equipment. Fences had holes that went unmended for years, allowing writers to enter storage facilities at. The mechanical car washers broke down and were not fixed, meaning trains ran covered in of paint that obscured windows and maps. This environment of neglect signaled to the public that the state had lost control of its subterranean territory, contributing to a sharp rise in felonies committed within the system. Between 1976 and 1980, the subway became a lawless zone where the physical environment actively encouraged disorder.
Financial mismanagement exacerbated the physical decay. In September 1975, the fare was raised from 35 cents to 50 cents, a 43 percent increase that failed to close the deficit due to plummeting ridership. Governor Hugh Carey and Mayor Ed Koch later engaged in "Save the Fare" politics, artificially holding the price at 50 cents until 1980 even as inflation raged. This political maneuvering starved the MTA of revenue exactly when it needed cash to restart maintenance programs. The result was a "death spiral": service quality dropped, riders fled to automobiles, revenue fell, and service was cut further. By 1982, ridership had sunk to levels not seen since 1917, even with the city's population being significantly larger.
The turning point arrived with the appointment of Richard Ravitch as MTA Chairman in 1979. Ravitch commissioned a detailed audit of the system's physical plant, which produced a report that shocked Albany. The assessment concluded that the subway needed $14 billion (in 1980 dollars) over ten years just to return to a "state of good repair", a term that entered the lexicon to describe the baseline functionality that had been lost. Ravitch warned that without this massive infusion of capital, the system would cease to function by the mid-1980s. This report led to the passage of the Transportation Systems Bond Acts and the creation of the five-year Capital Program in 1982, a method that forced the state to commit to long-term infrastructure funding rather than year-to-year improvisation.
The legacy of the 1975 fiscal insolvency remains in the MTA's 2026 operating budget. To fund the massive reconstruction efforts that began in 1982, the MTA relied heavily on bonding, paying for the sins of the 1970s with credit cards. By 2017, debt service consumed approximately 17 percent of the MTA's operating budget, a figure that continues to constrain the agency in 2026. The signal delays and power failures that plague modern commuters are frequently traced to components that should have been upgraded forty years ago were instead patched together during the emergency years. The decision to defer maintenance in 1975 did not save money; it transferred a much larger bill to future generations, who are paying the interest on the neglect of their predecessors.
Impact of Deferred Maintenance: Key Metrics (1977, 1981)
Metric
1977 Status
1981 Status
Change
Mean Distance Between Failures (MDBF)
13, 900 miles
6, 639 miles
-52%
Red Tag Speed Zones
< 100 (est.)
> 400
+300%
Derailments (Annual)
Low frequency
30
Severe Increase
Fare Cost
50 cents
75 cents
+50%
Crime Statistics and Rolling Stock Vandalism Eras (1975, 1990)
Dual Contracts Expansion and Fare Cap Economics (1913, 1940)
The fiscal collapse of New York City in 1975 triggered a fifteen-year period where the subway system ceased to function as a reliable transit network and instead operated as a dangerous, subterranean symbol of urban decay. By 1981, the system reached its mechanical nadir. Deferred maintenance, a policy choice born of bankruptcy, caused the Mean Distance Between Failures (MDBF) for the subway fleet to plummet. In 1970, a train could travel 24, 000 miles before breaking down. By 1981, that figure collapsed to 6, 639 miles. Commuters faced a daily gamble; trains frequently stalled in dark tunnels, air conditioning was nonexistent in summer, and doors frequently failed to open. The infrastructure did not age; it disintegrated.
The mechanical rot found its most expensive expression in the R46 rolling stock. Ordered from the Pullman Standard Company, these 75-foot cars were intended to modernize the B Division. Instead, they became a liability. Engineers discovered that the lightweight Rockwell HPT-2 trucks, the chassis holding the wheels, developed structural cracks after minimal use. By 1980, inspectors identified over 1, 700 cracks across the fleet. Mayor Ed Koch was forced to order the removal of hundreds of these brand-new cars from service during rush hours, crippling capacity. The Transit Authority eventually sued Pullman Standard, a legal battle that contributed to the manufacturer's exit from the passenger rail business. The R46 debacle left the MTA with a fleet that was new yet structurally unsound, forcing the agency to rely on pre-war equipment that was rapidly deteriorating.
Physical danger compounded mechanical unreliability. Track fires became a daily occurrence, driven by the accumulation of trash and grease that reduced track gangs could not clear. In 1981 alone, the system suffered approximately 1, 800 track fires, nearly five per day. These fires frequently trapped passengers in smoke-filled tunnels, necessitating evacuations along narrow catwalks. Derailments also spiked. In a single week in 1980, two major derailments occurred, driven by loose rails and rotting ties. The system was literally coming apart beneath the wheels of the trains.
Visually, the system surrendered to the "whole car" graffiti era. What began in the early 1970s as tagging by writers like Taki 183 evolved into top-to-bottom murals that covered windows, maps, and safety signage. By 1982, nearly every car in the fleet was covered in spray paint. The Transit Authority's initial response was the "white elephant" strategy: painting cars entirely white to discourage artists. This failed spectacularly, as the white cars provided a fresh, high-contrast canvas for writers. The paint fumes, combined with the smell of urine and ozone, created a sensory environment that repelled the middle class. Ridership crashed to 989 million in 1982, the lowest level since 1917. The subway, once the artery of the city, had become a transport of last resort.
Crime statistics from this era reveal a lawless environment. Felonies within the subway system rose relentlessly, jumping from 12, 908 in 1980 to over 15, 000 in 1981. By 1990, felonies would peak at 17, 497, roughly 48 serious crimes per day. Robberies were particularly widespread, with "wolf packs" of teenagers targeting passengers. The perception of danger exceeded even the grim statistics. The Transit Police, underfunded and demoralized, struggled to patrol the labyrinthine network. Radios frequently did not work in tunnels, leaving officers cut off from dispatchers. This vacuum of authority set the stage for one of the most polarizing moments in New York history.
On December 22, 1984, the simmering public rage erupted on a southbound 2 train. Bernhard Goetz, a 37-year-old electronics specialist, was method by four teenagers, Barry Allen, Troy Canty, Darrell Cabey, and James Ramseur, who demanded five dollars. Goetz, who had been mugged previously, drew a. 38-caliber Smith & Wesson revolver and fired five shots. He wounded all four youths, severing Cabey's spinal cord and leaving him paralyzed. Goetz fled into the tunnels surrendered days later. The public reaction was immediate and fierce. While the legal system charged him with attempted murder, of the ridership hailed him as a vigilante hero who did what the state refused to do: fight back. The incident exposed the complete loss of faith in the Transit Authority's ability to guarantee basic safety.
Amidst this collapse, the MTA hired David Gunn as president in 1984. Gunn, a disciplined manager with a background in freight and commuter rail, rejected the defeatist attitude that graffiti was an unstoppable cultural force. He initiated the "Clean Car Program," a strategy based on zero tolerance. Gunn established a simple rule: if a car was tagged, it was removed from service immediately. It would not return until it was clean. This disrupted the feedback loop for graffiti writers, who sought visibility for their work. If their "pieces" never ran in service, the effort was wasted. Gunn started with the 7 train, securing the Corona Yard with double fences and guard dogs. He then moved line by line.
The program required immense resources. The MTA installed automated car washes and employed manual cleaning crews who used potent chemical solvents to strip of paint. Gunn also introduced the "Redbird" scheme for the older IRT fleet, a deep maroon paint that was resistant to graffiti and easy to spot-clean. The battle was attrition warfare. Writers would bomb a yard overnight, and Gunn's crews would bleach the trains before morning rush. Slowly, the clean trains began to outnumber the dirty ones. On May 12, 1989, the Transit Authority declared victory as the last graffiti-covered car was removed from service. This visual turnaround was the tangible sign that management had regained control of the system.
System Decay Indicators (1970, 1989)
Metric
1970 Status
1981 Nadir
1989 Recovery
Mean Distance Between Failures (MDBF)
24, 000 miles
6, 639 miles
~30, 000 miles
Annual Ridership
1. 26 billion
989 million (1982)
1. 0 billion
Felonies per Year
~8, 000
15, 295
16, 000+
Track Fires (Annual)
Low
1, 800
Reduced
Graffiti Coverage
Minimal
95%+ of Fleet
0% (Clean Car Program)
The recovery of the rolling stock coincided with the General Overhaul (GOH) program. The MTA spent billions to rebuild the R26 through R46 fleets from the wheels up. The R46 cars, once the shame of the system, were sent to Morrison-Knudsen for complete remanufacturing, where their defective trucks were replaced and their interiors modernized. This capital investment, funded by state bonds, halted the mechanical collapse. By 1990, the MDBF had risen significantly, and air conditioning became reliable again. Yet, while the trains were clean and running, the crime rate remained stubbornly high, awaiting the policing revolutions of the decade to fully reclaim the underground environment.
Capital Program Solvency and Automatic Fare Collection (1982, 2003)
By 1982, the New York City Subway had ceased to function as a reliable transit network. Decades of deferred maintenance, a fiscal emergency in the 1970s, and political negligence had reduced the system to a state of industrial decay. The Mean Distance Between Failures (MDBF), the average distance a train travels before breaking down, had plummeted to a catastrophic 7, 186 miles. Track fires were routine. Derailments occurred every 18 days. Graffiti covered every square inch of the fleet, obscuring windows and maps. In this climate of collapse, MTA Chairman Richard Ravitch declared a state of emergency, admitting that the system was not struggling, dying.
The response was the Five-Year Capital Program, launched in 1982 with a budget of $7. 6 billion. This initiative marked a fundamental shift in the agency's philosophy: expansion was abandoned in favor of a "State of Good Repair." To fund this massive reconstruction, the state legislature passed the Transportation Systems Assistance and Financing Act of 1981, which allowed the MTA to problem bonds backed by future fare revenue. This decision saved the subway physically shackled it financially, initiating a pattern of debt service that would consume an increasing percentage of the operating budget in the decades to follow. The capital injection prioritized the invisible important organs of the system: track replacement, signal repair, and the rehabilitation of maintenance yards.
While engineers battled corrosion and steel fatigue, the Transit Authority waged a parallel war against fare evasion and the physical limitations of the token. The brass "Y-cut" token, introduced in 1970, and its 1980 "bullseye" successor were to a grotesque form of theft known as "token sucking." Thieves would jam the turnstile slot with paper, wait for a frustrated passenger to walk away after a failed attempt to enter, and then place their lips over the slot to inhale the stuck token. This practice became so prevalent that booth clerks resorted to sprinkling chili powder or spraying Mace into the slots to deter the thieves. The token also limited the MTA's ability to implement complex fare structures; a metal coin could not distinguish between a daily commuter and a tourist, nor could it facilitate transfers between bus and subway without paper slips.
The solution arrived in the form of the MetroCard, a magnetic stripe technology developed by Cubic Transportation Systems. The transition was technically perilous and politically. The MTA awarded the contract in the early 1990s, full implementation required retrofitting every turnstile and bus farebox in the city. The MetroCard debuted in 1993 at select stations, initially coexisting with the token. Its true power materialized in 1997 with the introduction of "One City, One Fare," which allowed free transfers between subways and buses. This policy change immediately altered ridership patterns, lowering the cost of travel for residents in the outer boroughs who relied on two-leg commutes. In 1998, the introduction of unlimited-ride cards further decoupled revenue from individual trips, incentivizing frequent use and fueling a ridership surge that would eventually the system's capacity.
As the fare collection system modernized, so did the rolling stock. The "Redbird" cars (R26 through R36), painted a deep Tuscan red to hide graffiti, had been the workhorses of the IRT division since the 1964 World's Fair. By the late 1990s, these cars were mechanically obsolete and absence air conditioning. Their replacement was the R142 and R142A fleet, built by Bombardier and Kawasaki. These "New Technology Trains" featured bright interiors, automated announcements, and electronic strip maps. The retirement of the Redbirds was executed with industrial efficiency: rather than being scrapped, 1, 269 cars were stripped of hazardous materials and dumped into the Atlantic Ocean to form artificial reefs off the coasts of Delaware, Georgia, and South Carolina. This "Redbird Reef" program saved the MTA millions in disposal costs while creating marine habitats, a rare convergence of fiscal prudence and environmental utility.
The era of the token ended definitively at midnight on May 3, 2003. The last token was sold at the Middletown Road station in the Bronx, closing a 50-year chapter of transit history. By this time, the system had recovered significantly from the nadir of 1982. Ridership had rebounded from 1 billion to approximately 1. 4 billion annually. The MDBF had risen from 7, 000 miles to over 100, 000 miles. Yet, the victory was qualified. The capital programs had restored the system to functionality, the underlying financial model relied heavily on borrowing. The debt load incurred to fix the tracks in the 1980s and 1990s remained on the books, a silent liability that would complicate future budgets. The subway was no longer a national embarrassment, it had become a mortgaged asset, running on borrowed time and borrowed money.
Evolution of Fare Media and Rolling Stock (1980, 2003)
Year
Fare Media Event
Rolling Stock Milestone
System Status
1980
"Bullseye" token introduced ($0. 60 fare).
R1-R9 cars still in service; graffiti epidemic peaks.
State of Emergency declared (1982).
1989
Fare rises to $1. 15.
Graffiti eradicated from fleet (Clean Car Program).
MDBF begins slow recovery.
1993
MetroCard pilot begins at Whitehall St/South Ferry.
Redbirds (R26-R36) dominate IRT lines.
Ridership stabilizes.
1997
Free bus/subway transfers implemented.
R142 contracts awarded to Bombardier/Kawasaki.
"One City, One Fare" boosts outer borough mobility.
2003
Tokens discontinued (May 3).
Last Redbird run (Nov 3); cars reefed in Atlantic.
Ridership hits 1. 4 billion; AFC fully implemented.
Hurricane Sandy Surge Levels and Infrastructure Corrosion (2012)
Municipal Unification and the Independent Subway System (1932, 1953)
The Atlantic Ocean did not flood the New York City subway on October 29, 2012; it waged chemical warfare against it. Hurricane Sandy drove a storm surge of nine feet into New York Harbor, which, synchronized with a high astronomical, produced a record water level of 13. 88 feet at The Battery. This exceeded the benchmark set by the hurricane of 1821, which had struck at low and thus spared the city the full height of its chance destruction. Sandy offered no such mercy. The Atlantic breached the archipelago's defenses, pouring hundreds of millions of gallons of saltwater into the subterranean arteries that define the city's economic existence. The inundation was specific, violent, and calculated by. The South Ferry station, a gleaming $530 million terminal opened only three years prior, filled with 15 million gallons of brine, turning the station into a submerged concrete box eighty feet deep. The water did not stop at the stations. It surged into the under-river tubes connecting Manhattan to Brooklyn and Queens. The Montague Tube, carrying the R train, swallowed 27 million gallons. The Greenpoint, Steinway, Cranberry, Joralemon, Clark, and Rutgers tubes all succumbed. In total, nine of the system's fourteen underwater crossings flooded. The sheer weight of the water was manageable; the chemistry was not. Saltwater is an electrolyte, a conductor of electricity, and a corrosive agent of relentless efficiency. When the ocean entered the tunnels, it bathed the third rails, signal relays, and switching method in a chloride-rich solution. Even after the Army Corps of Engineers and MTA crews pumped the water out, a task requiring weeks of continuous operation, the salt remained. It crystallized on circuit boards and seeped into the pores of the concrete bench walls that house the power cables. This created a "latent defect," a ticking clock where components would fail months or years later as the chlorides ate through copper and steel. The bench walls, structural ducts running the length of the tunnels, began to disintegrate, threatening to collapse onto the tracks. The recovery effort, branded "Fix & Fortify," became a decade-long industrial siege. The Montague Tube closed for fourteen months of total reconstruction. Crews stripped the tunnel to its cast-iron shell, replacing 11, 000 feet of track and 30, 000 feet of concrete duct banks. Yet, the most contentious battleground was the Canarsie Tunnel, which carries the L train and 225, 000 daily riders between Brooklyn and Manhattan. By 2019, the MTA had announced a fifteen-month total shutdown to rebuild the crumbling bench walls, a plan that triggered panic in Williamsburg and Bushwick. Real estate markets trembled; businesses prepared to close. Then, in a move that upended standard engineering protocol, Governor Andrew Cuomo intervened weeks before the shutdown. He summoned a team of deans from Columbia and Cornell engineering schools who proposed a radical deviation: abandon the demolition of the bench walls. Instead, they suggested racking the cables high on the tunnel curvature using fire-resistant, fiber-reinforced polymer (FRP) and encasing the damaging walls in protective sheathing. The "shutdown" became a slowdown, with work conducted on nights and weekends. The project finished in April 2020, ahead of schedule and under budget, validating a method that traditionalists had initially dismissed as risky. The rehabilitation of the F train's Rutgers Tube marked the final chapter of the Sandy tunnel repairs. Completed in 2021, this project used the same polymer racking techniques proven on the L line, signaling a permanent shift in maintenance philosophy. the tunnels were only part of the equation. The Coney Island Yard, the largest rapid transit yard in the world, had drowned under 27 million gallons of water, damaging specialized switching equipment and stranding rolling stock. By 2023, the MTA had erected a perimeter flood wall and installed heavy-duty sluice gates to seal the complex from Coney Island Creek, turning the yard into a against future surges. By early 2026, the physical scars of Sandy have largely been paved over, yet the threat profile has mutated. The completion of the Rockaway Line Resiliency Project in January 2026, which raised sea walls and hardened the Jamaica Bay crossing, signifies the end of the post-Sandy reconstruction era. The focus has shifted from coastal surge to pluvial flooding, flash rains that overwhelm city sewers and pour through subway grates, a phenomenon distinct from the ocean rising. The MTA's 2025-2029 Capital Plan, fully funded at $68. 4 billion, directs massive resources toward vent hardening and pump capacity, acknowledging that while the ocean was held back at the coast, the sky can still drown the system from above.
Major NYC Subway Tunnel Flooding & Restoration (Hurricane Sandy)
Tunnel Name
Line(s)
Gallons of Water
Damage Type
Restoration Status (2026)
Montague Tube
R
27 Million
Complete electrical/bench wall failure
Reopened 2014 (14-month closure)
Greenpoint Tube
G
3 Million
Signal/Pump corrosion
Repaired during weekend outages (2014)
Steinway Tube
7
Unknown (Severe)
Saltwater intrusion in duct banks
Restored with weekend closures (2013-2016)
Canarsie Tube
L
7 Million
Bench wall disintegration
Polymer racking fix completed April 2020
Rutgers Tube
F
1. 5 Million
Track/Signal corrosion
Completed 2021 (Final Sandy project)
South Ferry Station
1
15 Million
Total structural inundation (80ft deep)
Reopened 2017 after $369M rebuild
Signal System Failure Rates and the 2017 Transit Emergency
The collapse of the New York City Subway's reliability in 2017 did not happen instantly; it was the mathematical inevitability of deferred maintenance colliding with record ridership. On June 27, 2017, an A train derailed near 125th Street in Harlem. The incident injured 39 people and tore through the tunnel walls, its true impact was political. It forced Governor Andrew Cuomo to declare a "State of Emergency" two days later, formally acknowledging what daily commuters already knew: the system was broken. This declaration ended a decade of denial where officials ignored the rotting nervous system of the subway, its signals.
By mid-2017, the subway's On-Time Performance (OTP) had plummeted to 65 percent, the lowest recorded rate since the transit emergency of the 1970s. In January 2018 alone, more than 76, 000 trains reached their terminals late. The cause was rarely a single catastrophic failure rather a death by a thousand cuts. The signal system, responsible for spacing trains and preventing collisions, relied on technology that predated World War II. At the West 4th Street interlocking tower, a nerve center for the A, C, E, B, D, F, and M lines, the control board still used cloth-covered wiring installed in the 1930s. These wires, brittle and prone to shorting when exposed to moisture, controlled the movement of millions of passengers. When a single relay failed, the fail-safe turned all signals red, freezing the network.
The core defect lay in the "fixed-block" signaling architecture. Under this 19th-century logic, the track is divided into physical sections, or blocks. Only one train can occupy a block at a time, protected by a "buffer block" behind it. This system prioritizes safety strangles capacity. It cannot "see" a train's precise location, only which block it occupies. Consequently, trains must maintain large distances between them, limiting the number of trains per hour (TPH) to roughly 26-29 on the best lines. In contrast, modern Communications-Based Train Control (CBTC) uses radio transponders to pinpoint train positions, allowing them to run closer together safely. In 2017, only the L train and the 7 train used or were installing this technology. The rest of the system operated on mechanical relays that required parts frequently scavenged from defunct rail yards or custom-machined at great expense.
The financial neglect leading to this emergency was clear. Between 2005 and 2014, the percentage of the capital budget dedicated to signal modernization dropped from 20 percent to 14 percent. Money flowed instead to visible, ribbon-cutting projects like the Second Avenue Subway or the Fulton Center hub, while the invisible infrastructure rotted. The 2017 emergency forced a reversal of these priorities. The state implemented an $836 million "Subway Action Plan" (SAP) to stabilize the system. This cash infusion funded an army of workers to fix signals, seal leaks, and remove debris that frequently triggered track fires. The plan was a tourniquet, not a cure, yet it succeeded in halting the freefall. By 2019, major incidents, delays affecting 50 or more trains, had dropped significantly.
The true modernization effort arrived with the "Fast Forward" plan proposed by then-NYCT President Andy Byford in 2018. Byford argued that resignaling the system at the historical pace would take 40 years. He proposed doing it in 10. Although Byford resigned in 2020 amid clashes with Governor Cuomo, the technical core of his plan survived. The MTA shifted its strategy to "CBTC-centric" projects, decoupling signal upgrades from other station work to reduce costs. By December 2025, this method had lowered the cost per mile of signal installation by 33 percent compared to previous projects.
Data from late 2025 and early 2026 shows a system in recovery, though scars remain. Weekday OTP rebounded to approximately 83. 7 percent in 2025, with months hitting record highs of 85 percent. The L train, fully equipped with CBTC, consistently outperformed the rest of the network with OTP rates near 92 percent. In contrast, lines still dependent on fixed-block signals, such as the B and D, continued to lag. The proves that operational discipline can only go so far without hardware upgrades. The table compares the system's performance metrics during the emergency peak against the recovery period.
NYC Subway Performance Metrics: emergency vs. Recovery
Metric
2017 (emergency Peak)
2025/2026 (Recovery)
Weekday On-Time Performance (OTP)
65. 0%
83. 7%
Major Weekday Incidents (per month)
105 (Avg)
~48 (Avg)
Signal-Related Delays (Share of Total)
30% +
~12%
CBTC Coverage
L Line (Partial), 7 Line (In Progress)
L, 7 (Complete), Queens Blvd (Near Complete)
Monthly Delay Count (Total)
~76, 000 (Jan 2018)
~34, 000 (Avg)
The rollout of CBTC continues to define the system's future reliability. As of 2026, the Queens Boulevard Line (E, F, M, R) modernization is nearing completion, a massive undertaking that involved replacing interlockings at Briarwood and Parsons Boulevard. In December 2025, Governor Kathy Hochul released $1. 75 billion in congestion pricing revenue to fund signal upgrades on the A and C lines in Brooklyn and Queens. This project the Fulton Street and Liberty Avenue corridors, replacing 1930s equipment with digital controls. The funding also supports the deployment of R211 subway cars, which come pre-equipped with the necessary tech to communicate with the new signals.
Even with these advances, the system remains. Infrastructure and equipment failures still caused 31 percent of all delays in 2024. The "cloth wire" problem is not fully solved; it has been contained to fewer lines. The pause on congestion pricing in mid-2024 threatened to derail the entire capital program, creating a backlog of "state of good repair" projects. When funding resumed in late 2025, it prevented a cancellation of the A/C line upgrades, the lost time added inflation costs to an already expensive endeavor. The MTA races against the physical degradation of its assets. Every month of delay in resignaling increases the probability of another 2017-style collapse. The signals at West 4th Street may still click and clack with the rhythm of the 20th century, the city around them demands the precision of the 21st.
Pandemic Ridership Data and Federal Funding Allocation (2020, 2022)
Deferred Maintenance Costs and the 1975 Fiscal Insolvency
The onset of the COVID-19 pandemic in March 2020 triggered the most precipitous collapse in ridership in the 116-year history of the New York City Subway. On March 11, 2020, as the World Health Organization declared a global pandemic, the subway system carried its usual load of over 5. 5 million daily passengers. By mid-April, that number had evaporated, falling by 92 percent to fewer than 450, 000 daily riders. This statistical cliff was not a reflection of lockdown orders represented an existential threat to the Metropolitan Transportation Authority (MTA), which relied on farebox revenue for approximately 38 to 40 percent of its operating budget, a ratio significantly higher than other major North American transit agencies. With turnstiles stationary, the agency began losing approximately $200 million per week.
The financial terrain shifted immediately from long-term capital planning to imminent insolvency. In 2019, farebox revenue totaled roughly $6. 4 billion; in 2020, it plummeted to $2. 6 billion. This revenue gap exposed the fragility of a funding model dependent on high-volume commuting. Without federal intervention, the MTA faced a deficit projected to reach $16 billion by 2024, a scenario that would have necessitated draconian service cuts, massive layoffs, and a chance cessation of basic maintenance. The agency's credit rating was downgraded, and borrowing costs surged as Wall Street assessed the risk of a transit system with no passengers.
Washington responded with three major legislative packages between 2020 and 2021, injecting liquidity into the MTA to prevent total operational failure. These funds were not allocated for expansion or modernization were strictly for survival, paying the salaries of transit workers, maintaining signaling systems, and purchasing personal protective equipment. The federal government provided approximately $15 billion in total aid, a figure that eclipsed the entire cost of the Second Avenue Subway's phase. This capital injection allowed the trains to keep running, albeit with modified schedules and empty cars.
Federal Emergency Funding Allocated to the MTA (2020, 2021)
Legislation
Date Enacted
Approximate Allocation
Primary Purpose
CARES Act
March 2020
$4. 0 Billion
Immediate operating deficit coverage and payroll protection.
CRRSAA
December 2020
$4. 0 Billion
Continued operating assistance and revenue replacement.
American Rescue Plan (ARPA)
March 2021
$6. 5 Billion
Long-term fiscal stabilization and debt service support.
Operational underwent a historic shift on May 6, 2020, when Governor Andrew Cuomo ordered the subway system to close between 1: 00 AM and 5: 00 AM for "deep cleaning." This directive marked the intentional, scheduled overnight shutdown in the subway's history, breaking the "City That Never Sleeps" pledge that had held since 1904. The MTA deployed an army of cleaners to disinfect stations and rolling stock, a theater of hygiene intended to reassure a terrified public. While the scientific consensus later shifted regarding surface transmission of the virus, the nightly closures until May 2021. During these hours, the MTA operated an "Essential Connector" bus service, acknowledging that even with the lockdown, thousands of nurses, grocery store clerks, and responders still required mobility.
Public safety statistics during this period presented a paradox. Total crime numbers dropped because there were fewer victims available, yet the rate of violent crime per rider spiked dramatically. In 2020, the felony rate per million riders nearly doubled compared to 2019. The absence of "eyes on the street", or in this case, eyes on the platform, emboldened bad actors. High-profile incidents, including unprovoked shoving attacks, created a perception of lawlessness that lingered well into 2022. The subway became a shelter of last resort for the homeless population, forcing the MTA and city social services to engage in aggressive outreach programs that frequently yielded mixed results.
By 2022, the recovery trajectory proved stubborn and uneven. While federal funds balanced the books temporarily, ridership did not snap back to 2019 levels. Weekends recovered faster than weekdays, reaching 70 to 80 percent of pre-pandemic levels, while Monday-through-Friday traffic stagnated around 60 percent. This data signaled a permanent structural change in the city's economy: the era of the five-day in-person work week had ended for the professional class. The MTA was forced to reckon with a "new normal" where rush hour peaks were flattened, and the financial assumption of perpetual ridership growth was proven false. Even with the successful completion of the OMNY contactless payment rollout in late 2020, the convenience of tapping a phone could not overcome the reality that fewer people needed to travel to Midtown Manhattan.
Central Business District Tolling and Contactless Fare Adoption (2023, 2025)
By the onset of 2023, the Metropolitan Transportation Authority (MTA) faced a financial precipice defined by a single, clear reality: the federal COVID-19 relief funds that had kept the system solvent were evaporating. The agency's survival strategy hinged on two technological pivots intended to modernize revenue collection and stabilize the budget. The was the Central Business District (CBD) Tolling Program, commonly known as congestion pricing, designed to generate $1 billion annually to bond against $15 billion in capital improvements. The second was the full implementation of OMNY (One Metro New York), a contactless fare system meant to replace the MetroCard and seal revenue leakage. Between 2023 and 2025, both initiatives collided with political vacillation and vendor incompetence, plunging the transit network into a period of fiscal chaos and administrative improvisation.
The saga of congestion pricing, authorized by the state legislature in 2019, reached a fever pitch in early 2024. The plan called for a $15 base toll for passenger vehicles entering Manhattan south of 60th Street. The MTA spent over $500 million installing gantries, license plate readers, and detection infrastructure, readying the system for a June 30, 2024, launch. The revenue was legally "locked box" money, strictly for capital projects such as the Second Avenue Subway Phase 2, new signal systems on the A and C lines, and accessibility upgrades at over 20 stations. The bond markets had already priced in this revenue stream, and the MTA had awarded contracts based on its certainty.
On June 5, 2024, weeks before the toll was to begin, New York Governor Kathy Hochul delivered a stunning reversal. Citing economic fragility and the high cost of living, she ordered an "indefinite pause" on the program. The decision sent shockwaves through the agency. The immediate consequence was a "stop work" order on $16. 5 billion worth of capital projects. The Second Avenue Subway extension to 125th Street, a project decades in the making, halted. Credit rating agencies placed the MTA on negative watch, and the agency's leadership was forced to scramble for a Plan B while facing a $15 billion hole in the 2020, 2024 capital program.
The pause proved temporary damaging. Following the November 2024 elections, Governor Hochul reinstated the program, with a significant alteration: the base toll was slashed from $15 to $9. While this political maneuver allowed the system to activate in early 2025, the reduced rate severely curtailed the bonding capacity of the revenue. Instead of the anticipated $15 billion in capital generation, the lower toll supported a smaller tranche of debt, forcing the MTA to defer serious state-of-good-repair projects. The 2025, 2029 Capital Plan, released in late 2024 with a price tag of $68. 4 billion, arrived with a funding gap of nearly $33 billion, a deficit exacerbated by the diluted tolling revenue and the rising costs of debt service.
Parallel to the tolling debacle, the transition to contactless fare payment faltered. The OMNY system, contracted to Cubic Transportation Systems in 2017 for $573 million, was intended to fully retire the MetroCard by 2023. By 2024, the project cost had ballooned to $772 million, and the timeline had fractured. While OMNY readers were active at all subway turnstiles and on buses, the backend integration for the Long Island Rail Road (LIRR) and Metro-North Railroad was a disaster. In May 2024, the MTA Board took the drastic step of firing Cubic from the commuter rail portion of the contract, citing "serious" performance failures and a three-year delay. The agency handed the rail integration work to Masabi, a different vendor, with a target completion date pushed to late 2025 or 2026.
The physical rollout of OMNY vending machines also lagged. As of mid-2024, only 70 OMNY card vending machines existed across the entire network of 472 stations, leaving cash-reliant riders, frequently lower-income residents, tethered to the decaying MetroCard infrastructure. Consequently, the "death of the MetroCard," once scheduled for 2023, was postponed indefinitely. The dual-system operation forced the MTA to maintain aging magnetic stripe machines alongside new NFC readers, doubling maintenance load and confusing tourists. Fare evasion surged during this period, with the MTA estimating losses of $800 million in 2023 alone. The agency responded not with technology, with brute force and physical blocks.
Security theater became a defining aesthetic of the 2024 subway experience. In March 2024, following a series of high-profile assaults, Governor Hochul deployed 750 members of the National Guard to conduct bag checks at major transit hubs. The sight of camouflaged troops carrying assault rifles in Grand Central and Penn Station drew sharp criticism from civil liberties groups and transit advocates, who argued it projected an image of a war zone rather than a transit system. Governor Hochul defended the move as necessary for "psychological" reassurance, even as NYPD statistics showed a 2. 6% decrease in in total subway crime for the year. The agency also experimented with Evolv weapons detection scanners, a pilot program that largely failed due to high rates of false positives and the logistical impossibility of scanning millions of rushing commuters.
Ridership recovery stalled against a hard ceiling. Throughout 2024 and 2025, weekday subway ridership hovered stubbornly between 70% and 75% of pre-pandemic levels, equating to roughly 3. 5 to 4 million daily trips. The "five-day commute" had dissolved, replaced by a hybrid work model that permanently altered the system's peak-hour economics. Interestingly, weekend ridership recovered faster, frequently hitting 85% to 90% of 2019 levels, suggesting a shift in the subway's primary utility from a commuter funnel to a lifestyle connector. This shift, yet, did not offset the revenue loss from the missing Monday-to-Friday business traffic.
To plug the operating deficits, the state legislature increased the Payroll Mobility Tax (PMT) in 2023, levying a higher rate on large businesses within New York City. This generated approximately $1. 1 billion annually, stabilizing the operating budget through 2025 doing little to address the capital emergency. By the close of 2025, the MTA existed in a fragile stasis: the trains were running, the $9 toll was collecting revenue, and the National Guard remained a sporadic presence, the grand vision of a fully modernized, financially independent network had been whittled down by political compromise and contract mismanagement.
MTA Capital Program & Revenue Metrics (2023, 2025)
Metric
2023 Status
2024 emergency Point
2025 Reality
Congestion Toll
Planned ($15 base)
Paused (June); Revived ($9 Nov)
Active ($9 base); Bond capacity reduced
Capital Gap
Funded (Projected)
$15 Billion Shortfall
$33 Billion Shortfall (2025-29 Plan)
OMNY Cost
$600 Million (Est.)
$772 Million (Cubic fired from rail)
Cost rising; MetroCard remains
Daily Ridership
65-68% of 2019
70-72% of 2019
~75% of 2019 (Weekend>85%)
Fare Evasion Loss
~$600 Million
~$800 Million
High; Gate guards deployed
Operating Budget Deficits and Interborough Express Metrics (2026)
The financial pathology of New York City's transit network began long before the fiscal cliffs of the 2020s. It started with the nickel. When the Interborough Rapid Transit (IRT) Company opened the subway line in 1904, the five-cent fare was contractually locked for fifty years. This rigid pricing method, enforced by city politicians who feared voter backlash more than bankruptcy, doomed the private operators. By 1918, inflation from World War I had eroded the nickel's purchasing power, yet the fare remained static. The resulting financial strangulation forced the private IRT and BMT systems into insolvency, leading to municipal takeover in 1940. This original sin, the decoupling of revenue from operating reality, haunts the Metropolitan Transportation Authority (MTA) to this day. In 2026, the agency no longer battles a fixed nickel fare, it faces a structural deficit that threatens to consume the system from within.
By November 2025, the MTA managed to present a balanced operating budget for 2026, a feat achieved not through surging ridership, through aggressive "efficiency" savings and state subsidies. The agency identified $675 million in cost reductions to be realized between 2026 and 2029. These cuts target non-service areas, yet they mask a fragile equilibrium. The projected deficit for 2027 stands at $160 million, a figure that assumes the Payroll Mobility Tax remains strong and that ridership does not regress. The agency has shifted its revenue model. Where the subway once relied on the farebox for the vast majority of its funding, the 2026 model depends heavily on dedicated taxes and toll cross-subsidies. The rider pays less of the true cost than at any point in the system's history, a reality that leaves the network to the whims of Albany legislators.
The most immediate in the 2026 budget is fare evasion. In 2024 alone, the MTA lost approximately $1 billion to riders who simply refused to pay. The breakdown of this loss reveals a cultural shift in how New Yorkers view transit access. Bus fare evasion reached epidemic levels, with nearly 48 percent of riders boarding without paying. On the subway, evasion rates hovered between 10 and 14 percent. The financial impact is: the $350 million lost on the subway and $568 million lost on buses in 2024 equals the cost of completely renovating ten stations. The MTA's response, deploying "Eagle" enforcement teams and installing modern, paddle-free fare gates, has yielded only marginal gains. The "turnstile jumper" is no longer a statistical outlier a structural line item in the agency's deficit calculations.
Debt service remains the silent killer of the operating budget. In 2025, the MTA allocated $2. 52 billion solely to pay interest and principal on past borrowing. This figure represents roughly 12. 7 percent of the total operating budget, meaning nearly 13 cents of every fare dollar into the pockets of bondholders before a single train moves. This debt load is the accumulation of decades of "deferred maintenance" where capital improvements were funded by credit cards rather than cash. The 2025-2029 Capital Plan, while ambitious, piles more obligations onto this mountain. The Comptroller's office projects that debt service costs rise to $3. 5 billion annually by the late 2020s. If the debt-to-revenue ratio breaches 15 percent, the system enters a danger zone where service cuts become the only viable way to pay the bank.
Amidst this fiscal contraction, the MTA is attempting its most significant expansion in decades: the Interborough Express (IBX). Designed to connect Bay Ridge, Brooklyn, to Jackson Heights, Queens, the IBX utilizes the existing freight tracks of the Bay Ridge Branch. This 14-mile orbital line addresses a century-old flaw in the system's radial design, which forces riders to travel into Manhattan just to move between outer boroughs. By 2026, the project moved from a theoretical "Triboro RX" dream to a concrete engineering phase, with contracts awarded to the joint venture of Jacobs and HDR.
The metrics of the IBX, finalized in late 2025, reflect the compromises necessary to build transit in a dense, litigious city. The MTA selected Light Rail Transit (LRT) over heavy rail (conventional subway), a decision driven by cost and engineering constraints. Heavy rail would have required widening the existing trench and rebuilding dozens of, ballooning the budget beyond feasibility. The LRT choice, yet, comes with a $5. 5 billion price tag, nearly $400 million per mile for a line that uses an existing right-of-way. This cost escalation, up from early estimates of $2-3 billion, illustrates the "New York Premium" on infrastructure projects.
A serious engineering battle defined the IBX's final design in 2025. The original proposal called for street-running light rail through Middle Village, Queens, to avoid a costly tunnel expansion. Transit advocates and local residents revolted, arguing that mixing trains with street traffic would destroy reliability and replicate the slowness of a bus. In a rare pivot, the MTA agreed to bore a new tunnel beneath Metropolitan Avenue. This decision increased the project's speed and utility. Consequently, the ridership projection for 2026 was revised upward to 160, 000 daily passengers, a significant jump from the initial estimate of 115, 000. This adjustment makes the IBX one of the busiest chance light rail lines in North America before it even opens.
The following table summarizes the serious fiscal and operational metrics defining the system in 2026:
Metric
2026 Status / Value
Operating Budget Deficit (Projected)
Balanced (via $675M in )
2027 Projected Deficit
$160 Million
Annual Debt Service Cost
~$2. 52 Billion (12. 7% of budget)
Annual Fare Evasion Loss (2024)
$1 Billion ($568M Bus / $350M Subway)
Interborough Express (IBX) Cost
$5. 5 Billion
IBX Mode
Light Rail Transit (LRT)
IBX Daily Ridership Projection
160, 000 (Revised post-tunnel decision)
Bus Fare Evasion Rate
~48%
The choice of Light Rail for the IBX also exposes a limitation in long-term planning. While 160, 000 riders is a strong number, the Bay Ridge Branch corridor is wide enough to support a full subway line that could carry double that capacity. By opting for smaller, lighter trains to save upfront capital, the MTA risks building a line that be overcrowded on day one, repeating the mistake of the Lexington Avenue line which was overwhelmed immediately upon expansion. The decision prioritizes the 2026 capital budget over the 2076 capacity needs.
Congestion pricing remains the volatile variable in this equation. After the chaotic pause in 2024, the revenue stream from tolling Manhattan's Central Business District became essential to fund the 2025-2029 Capital Plan. Without this $15 billion injection, the IBX and modern signal upgrades would. The bond markets watched this political theater closely; any hesitation in implementing the tolls results in an immediate downgrade of the MTA's credit outlook, raising the cost of borrowing even further. In 2026, the system operates on a "lockbox" pledge, that toll revenue strictly fund capital projects, yet money is fungible, and the pressure to use capital funds to plug operating holes remains a constant political temptation.
The trajectory from 1700s horse-drawn omnibuses to the 2026 Light Rail plan shows a system that has grown in complexity lost its financial independence. The private transit barons of the 19th century operated with ruthless profit motives; the public authority of 2026 operates with a mandate for service a wallet full of IOUs. The IBX represents the future, orbital, connected, and modern, the operating budget represents the anchor dragging it back. Unless the $1 billion fare evasion hole is plugged and the debt service ratio is stabilized, the new tracks of the Interborough Express lead not to a transit renaissance, to a system too expensive to run and too important to close.
Why it matters: Migrant workers play a significant role in the global construction industry, with over 30% of the workforce being comprised of migrant labor. The complex subcontractor…
What do we know about Steam Power and Pneumatic Tube Prototypes?
The genesis of New York City's subway system lies not in the successful opening of 1904, in a series of daring, dangerous, and frequently bizarre Victorian experiments that predated it by thirty-five years. Between 1869 and 1899, the city oscillated between the allure of pneumatic propulsion and the grimy reality of steam-powered elevated trains.
What do we know about Contract One Financing and the Interborough Rapid Transit Monopoly?
The realization of New York's underground transit system began not with a shovel, with a poker game of high finance. On January 15, 1900, the Rapid Transit Commission opened bids for the "Contract One" project, a massive undertaking to build a subway from City Hall to the Bronx.
What do we know about Dual Contracts Expansion and Fare Cap Economics?
On March 19, 1913, New York City officials and private transit magnates gathered to sign the Dual Contracts, a set of agreements that would double the size of the rapid transit network and destroy the private companies that operated it. This deal, valued at roughly $337 million (equivalent to over $10 billion in 2026), remains one of the largest public works undertakings in human history.
What do we know about Municipal Unification and the Independent Subway System?
The Independent Subway System (IND) opened its doors at midnight on September 10, 1932, not as a transit line, as an act of municipal warfare. Mayor John F.
What do we know about Deferred Maintenance Costs and the Fiscal Insolvency?
The fiscal collapse of New York City in 1975 stands as the single most destructive event in the history of the subway, initiating a period of physical decay that nearly destroyed the network. While the popular narrative focuses on President Gerald Ford's refusal to provide a federal bailout, the specific engineering consequences of the emergency were far more damaging than the political theater.
What do we know about Crime Statistics and Rolling Stock Vandalism Eras?
The fiscal collapse of New York City in 1975 triggered a fifteen-year period where the subway system ceased to function as a reliable transit network and instead operated as a dangerous, subterranean symbol of urban decay. By 1981, the system reached its mechanical nadir.
What do we know about Capital Program Solvency and Automatic Fare Collection?
By 1982, the New York City Subway had ceased to function as a reliable transit network. Decades of deferred maintenance, a fiscal emergency in the 1970s, and political negligence had reduced the system to a state of industrial decay.
What do we know about Hurricane Sandy Surge Levels and Infrastructure Corrosion?
The Atlantic Ocean did not flood the New York City subway on October 29, 2012; it waged chemical warfare against it. Hurricane Sandy drove a storm surge of nine feet into New York Harbor, which, synchronized with a high astronomical, produced a record water level of 13.
What do we know about Signal System Failure Rates and the Transit Emergency?
The collapse of the New York City Subway's reliability in 2017 did not happen instantly; it was the mathematical inevitability of deferred maintenance colliding with record ridership. On June 27, 2017, an A train derailed near 125th Street in Harlem.
What do we know about Pandemic Ridership Data and Federal Funding Allocation?
The onset of the COVID-19 pandemic in March 2020 triggered the most precipitous collapse in ridership in the 116-year history of the New York City Subway. On March 11, 2020, as the World Health Organization declared a global pandemic, the subway system carried its usual load of over 5.
What do we know about Central Business District Tolling and Contactless Fare Adoption?
By the onset of 2023, the Metropolitan Transportation Authority (MTA) faced a financial precipice defined by a single, clear reality: the federal COVID-19 relief funds that had kept the system solvent were evaporating. The agency's survival strategy hinged on two technological pivots intended to modernize revenue collection and stabilize the budget.
What do we know about Operating Budget Deficits and Interborough Express Metrics?
The financial pathology of New York City's transit network began long before the fiscal cliffs of the 2020s. It started with the nickel.
Why it matters: The global apparel market reached a historic peak of $1.77 trillion in 2024, revealing a significant disparity between fashion brand profits and the dire conditions…
Why it matters: The legacy of corruption within the Vyapam board persists despite official rebranding efforts. The board's failure to maintain operational integrity has led to widespread fraud…
Why it matters: Cross-border VAT fraud is a major financial crime impacting economies globally. Carousel fraud, a common scheme, exploits VAT rules and results in substantial revenue losses…
Why it matters: Public records retention policies are essential for government transparency and accountability. The varying implementation of these policies across jurisdictions, challenges in managing electronic records, privacy…
Why it matters: Africa's struggle with corruption and insecurity is rooted in the collusion between political power and criminal networks. An investigation reveals how high-level figures in African…
Why it matters: Over a million Uyghurs and other Muslim minorities have been detained in Xinjiang's re-education facilities, facing indoctrination, forced labor, abuse, and surveillance. The Chinese government's…
Get updates on this place
Get verified alerts when this file is updated (verification required).