Verified Against Public And Audited RecordsLast Updated On: 2026-03-05
Reading time: ~56 min
File ID: EHGN-PLACE-36007
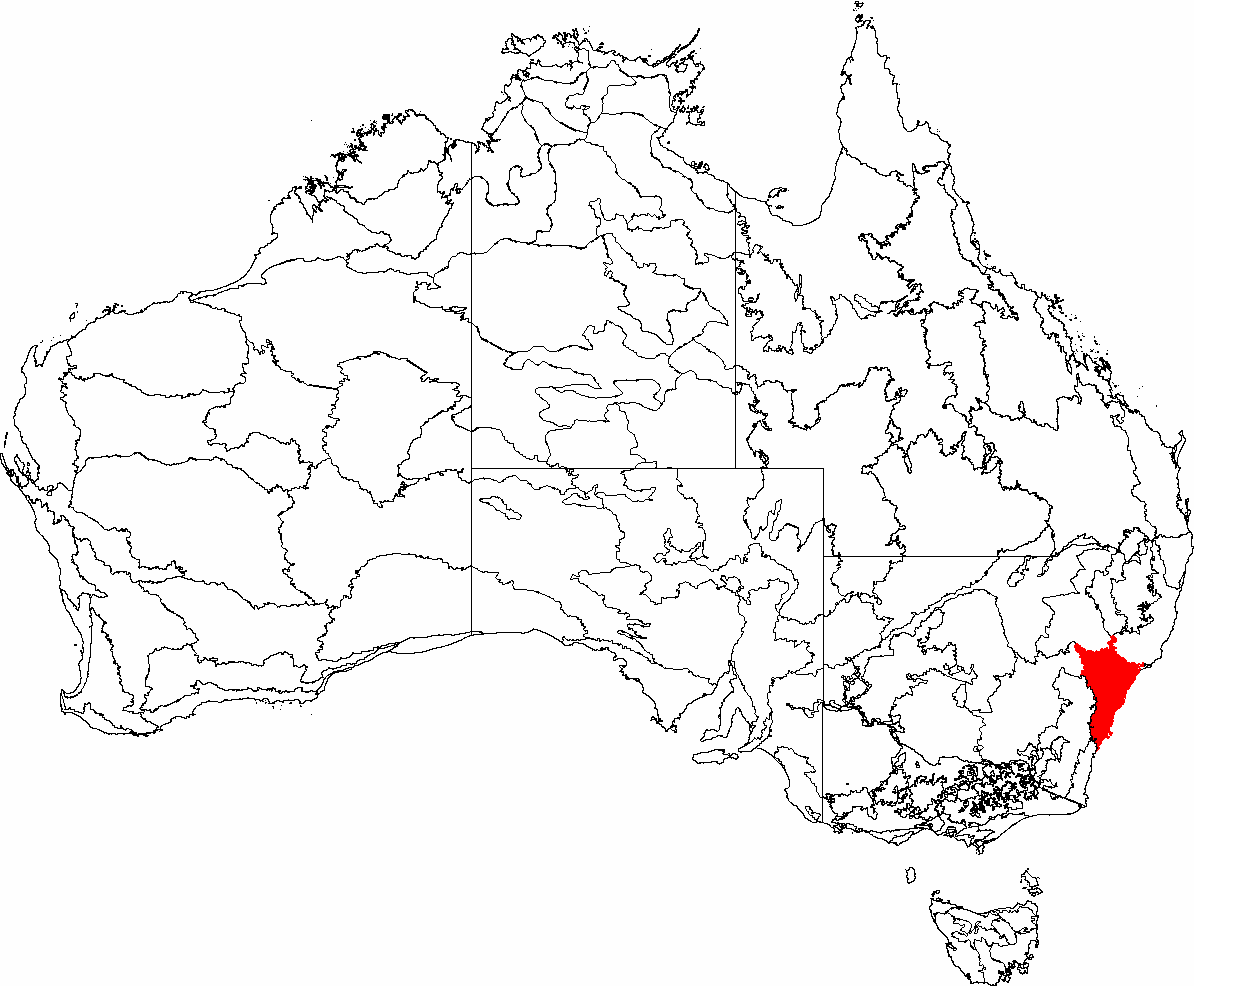
Investigative Bio of Sydney
Eora Nation Demographics and 1788 Displacement Metrics
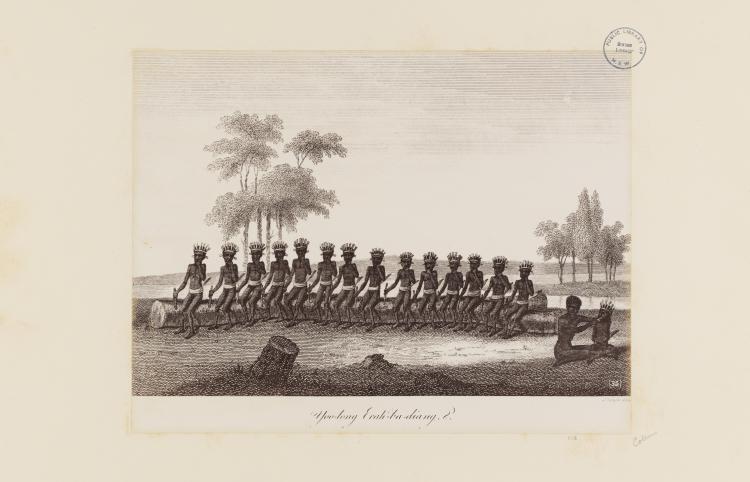
The demographic reality of the Sydney basin prior to January 1788 bears no resemblance to the "Terra Nullius" fiction later propagated by colonial courts. The region defined as Greater Sydney was the sovereign territory of the Eora Nation. This shared comprised approximately 29 distinct clan groups. These clans operated within a complex estate management system. They did not wander aimlessly. They maintained specific boundaries. They managed food resources through controlled burns and seasonal harvesting. Historical estimates for the Aboriginal population in the Sydney basin vary. Governor Arthur Phillip estimated 1, 500 people lived within 10 miles of Port Jackson. Modern archaeological and anthropological models suggest a much higher density. The population likely exceeded 3, 000 to 5, 000 people across the coastal and inland plains. The Gadigal clan alone held the southern side of the harbour. Their numbers stood at approximately 60 people in 1788. The Cammeraygal on the north shore were more numerous and feared as a political entity.
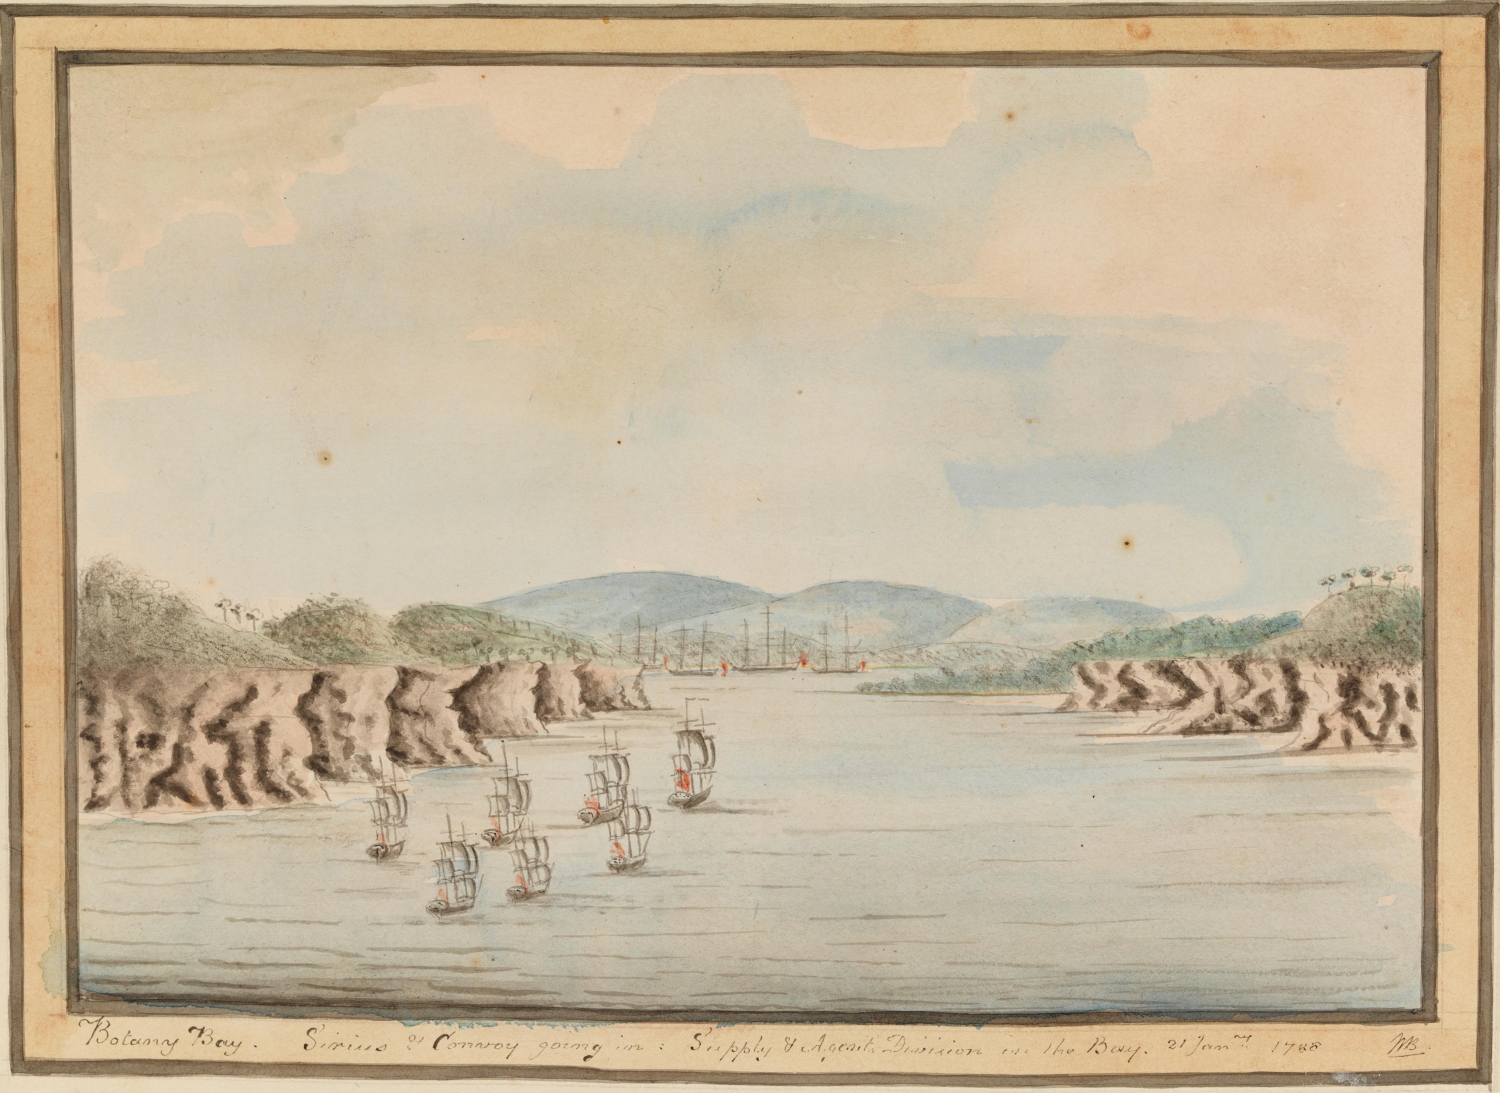
The arrival of the Fleet on January 26, 1788, constituted an immediate demographic shock. Eleven ships entered the harbour. They carried a human cargo that instantly rivaled the local population in size. Official manifests list approximately 1, 483 people landing at Sydney Cove. This number included 759 convicts, comprising 568 men and 191 women. It also included 13 children of convicts. The military contingent consisted of 211 marines along with 27 wives and 14 children. The Governor and his civil staff added another 20 people. This sudden influx created an instant caloric deficit in the region. The British absence the knowledge to farm the local soil. They turned immediately to the harbour for fish. They competed directly with the Eora for the primary protein source of the coastal clans. This competition turned violent within months as nets were stolen and spears were thrown.
The demographic catastrophe that followed in 1789 remains the single most devastating event in the history of Sydney. A smallpox epidemic erupted in April 1789. The Eora called it "Galgalla". It did not originate from the Aboriginal population. It had no precedent in their medical history. The source remains a subject of forensic debate. Yet the Fleet surgeons carried "variolous matter" in sealed bottles for chance inoculation. The virus tore through the clans with a mortality rate estimated between 50% and 70%. The impact on the Gadigal was near total. By 1791, only three Gadigal men remained alive. The social fabric of the Eora nation collapsed. Elders died before passing on essential law and knowledge. Children died before they could learn survival skills. The British observed bodies floating in the harbour and lying unburied in rock shelters.
Displacement shifted from biological warfare to bureaucratic erasure in the 1790s. The colonial administration began granting land to emancipists and officers. This process formally alienated Aboriginal people from their country. Governor Phillip issued the land grant in 1792 to James Ruse at Parramatta. The pace accelerated under the New South Wales Corps. By 1810, the colonial government had granted approximately 100, 000 acres of land. These grants were not empty fields. They were the hunting grounds and ceremonial sites of the Wangal, Bediagal, and Burramattagal clans. Settlers erected fences. They shot game that the Eora relied upon. They cleared the forests that provided shelter. The British legal system recognized the land grants as freehold title. It recognized the Eora presence only as a nuisance to be driven off.
Demographic & Displacement Metrics: Sydney Basin (1788-1810)
Metric
Data Point
Context
Est. Eora Population (1788)
3, 000, 5, 000
29 Clans in Sydney Basin
Fleet Arrivals (1788)
~1, 483
Convicts, Marines, Civil Staff
Smallpox Mortality (1789)
50%, 90%
Varies by clan; Gadigal hit hardest
Gadigal Survivors (1791)
~3
Documented by colonial observers
Land Granted (by 1810)
~100, 000 Acres
Permanent alienation of territory
Resistance to this displacement was fierce demographically doomed by the smallpox collapse. The warrior Pemulwuy led a guerrilla campaign against the settlements from 1790 until his death in 1802. He targeted the economic assets of the colony. He burned crops and speared livestock. His resistance forced the British to conduct military sorties into the frontier. Yet the in numbers and firepower grew every year. More convict transports arrived. The British population in Sydney expanded to over 10, 000 by 1810. The Aboriginal population in the same area continued to decline or was forced to the fringes. The "protection" policies of the late 19th century further removed Aboriginal people from the city proper. The government forced them onto missions and reserves like La Perouse. The city of Sydney declared itself white by design.
The 20th century saw a slow reversal of this erasure. Aboriginal families began to move back into the inner city in search of work. Redfern became a new cultural hub in the 1930s and 1940s. It functioned as a gathering place for the diaspora of displaced clans from across New South Wales. The population grew even with aggressive policing and social exclusion. Activism in the 1970s cemented the Aboriginal presence in the city. The establishment of the Aboriginal Medical Service and the Aboriginal Legal Service in Redfern marked a return of sovereign agency. The census data began to reflect this resurgence as people felt safer identifying their heritage.
Current demographic data shows a significant recovery. The 2021 Census recorded 90, 939 Aboriginal and Torres Strait Islander people living in Greater Sydney. This represents approximately 1. 7% of the total population. This figure is a massive increase from the statistical invisibility of the early 1900s. The growth is driven by high birth rates and a greater willingness of individuals to identify as Indigenous. Projections for 2026 suggest this number surpass 100, 000. The demographic profile is young. The median age of the Aboriginal population in Sydney is 24 years. The non-Indigenous median age is 37. This youth bulge indicates that the Aboriginal voice in Sydney grow louder and more influential in the coming decade.
The geography of this modern population differs from the 1788 clan map. The highest concentrations of Aboriginal people today are found in Western Sydney. Suburbs like Blacktown, Penrith, and Campbelltown hold the largest communities. This distribution reflects the economics of housing rather than traditional estate boundaries. Yet the connection to the harbour remains. The Gadigal people are acknowledged as the custodians of the CBD. Welcome to Country ceremonies are standard protocol. This symbolic recognition contrasts sharply with the 1789 reality of bodies on the beaches. The survival of the Eora descendants and the broader Aboriginal community in Sydney stands as a defiance of the 1788 displacement metrics. The objective of the colonial project was replacement. The data shows that while displacement occurred, erasure failed.
The gap between the 1788 sovereignty and the 2026 reality remains the central tension of Sydney. The land grants of the 1790s form the basis of all modern property law in the city. Every title deed in Sydney rests on the dispossession of the 29 clans. No treaty exists. No compensation was paid for the 100, 000 acres seized by 1810. The population has recovered in numbers not in assets. The economic between Indigenous and non-Indigenous residents in Sydney remains serious. The median weekly household income for Aboriginal families in Sydney lags behind the general population. The incarceration rates remain disproportionately high. The metrics of 2026 show a vibrant, growing community that still fights the structural legacy of the Fleet.
Penal Colony Economics and Rum Corps Corruption (1788, 1810)
Eora Nation Demographics and 1788 Displacement Metrics
The departure of Governor Arthur Phillip in December 1792 triggered an immediate and calculated seizure of economic power by the New South Wales Corps. For the three years, under the interim command of Major Francis Grose and Captain William Paterson, the colony functioned less as a penal settlement and more as a deregulated trading cartel. The military officers, entrusted with the enforcement of British law, inverted their mandate to establish a monopoly on all imported goods. This period, frequently sanitised in general histories, represented a systematic looting of the Commissariat store and the deliberate suppression of a specie-based currency in favour of a volatile, officer-controlled rum standard.
The mechanics of this monopoly were simple yet devastatingly. The officers of the NSW Corps, nicknamed the "Rum Corps," pooled their regimental funds to purchase entire cargoes from arriving merchant vessels before they docked. By controlling the point of entry, they dictated prices to the rest of the colony. The markup on spirits was particularly egregious. Historical records indicate that rum purchased by the officers for 7 shillings and 6 pence per gallon was frequently sold to settlers and convicts for as much as £8. This represents a markup of over 2, 000%. With no silver or gold coinage in circulation, this inflated spirit became the de facto currency. Wages for labour, crop payments, and even legal fines were calculated in gallons of rum, a currency that the officers alone could mint through importation.
The corruption extended deep into the Commissariat, the government store intended to feed the colony. Officers manipulated the store's ledgers to buy their own wheat at inflated prices while purchasing goods from the store at fixed, low rates. This arbitrage drained the British Treasury while enriching a small circle of military elites. The impact on the colony's demographics and wealth distribution was clear. By 1800, the population had grown to approximately 6, 000, yet the vast majority of productive land and capital was concentrated in the hands of fewer than two dozen officers. The "public farm" model envisioned by Phillip was abandoned. In its place, officers granted themselves and their favourites prime agricultural land, using convict labour fed by the government to work private estates.
John Macarthur stands as the primary architect of this wealth transfer. Arriving as a lieutenant, Macarthur manipulated his position to amass a fortune that dwarfed his official salary. In 1793, Grose granted him 100 acres of the best land at Parramatta, which Macarthur named Elizabeth Farm. By 1805, through a combination of aggressive lobbying in London and local manipulation, Macarthur had secured a grant of 5, 000 acres in the Cowpastures (modern-day Camden). This grant, ostensibly for sheep breeding, privatised the colony's best grazing land. Macarthur's trajectory from a junior officer to a landed magnate with 5, 000 acres illustrates the of the theft; he did not participate in the economy, he engineered it to serve his interests.
Asset Accumulation by Key Figures (1793, 1810)
Figure
Role
1793 Land Holdings
1810 Land/Asset Status
John Macarthur
Officer / Agitator
100 acres (Elizabeth Farm)
>5, 000 acres (Camden Park)
Simeon Lord
Emancipist Merchant
0 acres (Convict status)
1, 140 acres, 300 cattle, ships
NSW Corps Officers
Military Junta
Minimal
Monopoly on import trade
Even with the Corps' stranglehold, a counter-economy of emancipists began to emerge. Simeon Lord, a former convict, demonstrated that the officers' monopoly was not impenetrable. By 1810, Lord held 1, 140 acres of land, 300 cattle, and 1, 000 sheep. He partnered with other emancipists like Henry Kable and James Underwood to build ships and engage in sealing and whaling, bypassing the Corps' control of the Commissariat. Lord's rise from a convict serving a seven-year sentence to one of Sydney's wealthiest merchants by 1810 challenges the narrative of total military dominance, showing that the Corps' corruption created cracks that shrewd operators could exploit.
The arrival of Governor William Bligh in 1806 marked the inevitable collision between the colonial government and the Rum Corps cartel. Bligh, acting on instructions from London, attempted to the barter system and enforce the use of sterling currency. He prohibited the use of spirits as payment for labour and moved to reclaim land grants that he viewed as illegal. This was not a political dispute; it was a direct threat to the officers' business model. The so-called "Rum Rebellion" of January 26, 1808, was a hostile corporate takeover disguised as a military coup. Major George Johnston and John Macarthur deposed Bligh not to restore liberty, to protect the 2, 000% profit margins on rum and the security of their land titles.
The interregnum that followed Bligh's removal (1808, 1810) saw a final frenzy of land grabbing. The rebel administration issued hundreds of land grants to its supporters, attempting to create facts on the ground before London could react. When Governor Lachlan Macquarie arrived in 1810 to restore order, he found a colony where the distinction between public service and private profit had been obliterated. Although Macquarie cancelled the grants issued by the rebel government, the economic structure built by the Corps remained. The officers had successfully transformed a penal camp into a private enterprise, leaving a legacy of wealth inequality and land concentration that would define Sydney for the century.
Basin Topography and Urban Sprawl Density Statistics
The Sydney Basin's geological reality is a cage of Triassic sandstone and Wianamatta shale that has dictated the city's chaotic urban form since 1788. The basin is not a passive foundation an active constraint; a structural trough bounded by the Blue Mountains to the west, the Hornsby Plateau to the north, and the Woronora Plateau to the south. This topography forced early colonial expansion into a jagged, westward bleed along the Parramatta River, avoiding the nutrient-poor Hawkesbury sandstone ridges in favor of the clay-based shale soils suitable for agriculture. By 2026, this geological determinism has resulted in a sprawling, asymmetrical metropolis where 5. 3 million people occupy a footprint comparable to cities with triple the population. ### Geological Determinism and the Shale Trap The basin's topography created a "shale trap" that funneled 20th-century sprawl directly into the hottest, driest sectors of the region. The Wianamatta shale plains of Western Sydney, once the food bowl for the colony, are a heat island of low-density asphalt. * **Sandstone blocks:** The rugged Hawkesbury sandstone plateaus (Royal National Park, Ku-ring-gai) historically blocked north-south density, forcing infrastructure to snake through expensive, narrow corridors. * **Shale Sprawl:** The flat, easily cleared Cumberland Plain became the route of least resistance for developers. This geological convenience is why 2024-2025 housing focus heavily on the North West and South West Growth Areas, even with these regions experiencing summer temperatures 8, 10°C higher than the coastal sandstone ridges. ### Urban Density Metrics: The "Missing Middle" Failure Sydney's density profile is an anomaly among global cities. It exhibits a "density crater", high density in the CBD and inner ring, plummeting immediately to low-density detached housing, with a severe absence of medium-density stock. As of 2026, the "missing middle" remains a statistical canyon in the city's housing data.
Table 3. 1: Comparative Urban Density Statistics (2025 Data)
Metric
Sydney (Greater Capital Area)
London (Greater London)
Los Angeles (Urbanized Area)
Population Density
~440 people / km²
~5, 700 people / km²
~2, 400 people / km²
Built-Up Area Density
~37 people / hectare
~105 people / hectare
~45 people / hectare
Detached Housing %
55%
14%
48%
Medium Density %
16% (stagnant)
48%
22%
The data exposes the of Sydney's land use. While the inner city achieves densities above 15, 000 people per square kilometer (comparable to Paris), the vast majority of the basin operates at sub-urban efficiency. The 2024 *National Housing Pipeline* report revealed a shortfall of 150, 600 homes against the Housing Accord target, driven by a planning system that bans medium density in 62% of residential zones. The "Low and Mid-Rise Housing Policy" introduced in 2024 attempted to override these local controls, yet 2025 approval data shows a 5% decline in dwelling approvals, hitting a 12-year low of 42, 800 units. ### Infrastructure Corridors and Density Modification Major infrastructure projects have attempted to retrofit density into this sprawling footprint, with mixed results. * **Sydney Metro:** The Metro Northwest corridor has successfully triggered high-density clusters. Tallawong and Kellyville have seen dwelling approvals surge, with over 15, 000 new units planned on Metro-owned land alone by 2026. This represents a successful, albeit localized, break from the low-density norm. * **WestConnex:** Conversely, the WestConnex motorway project has failed to catalyze the promised "Parramatta Road Corridor" renewal. Traffic modeling from 2023-2025 indicated that surface traffic volumes would remain too high to support the pedestrian-friendly density originally pitched. Instead of a high-density boulevard, the corridor remains a choked arterial, with density gains delayed by ventilation and noise constraints. ### The Cumberland Plain Eradication The cost of this low-density sprawl is measured in the destruction of the Cumberland Plain Woodland. Once covering 107, 000 hectares, less than 6% of this ecosystem remains intact as of 2026. The *Cumberland Plain Conservation Plan* (CPCP), approved to facilitate growth to 2056, sanctions the clearing of over 10, 000 hectares of remaining vegetation. * **Clearing Rate:** In the 2024-2025 financial year alone, developers purchased credits to offset the destruction of hundreds of hectares of serious endangered woodland. * **Fragmentation:** The remaining pockets are biologically by housing estates, rendering them genetically non-viable without massive human intervention. The "offsets" purchased frequently protect land already unlikely to be developed, resulting in a net loss of total vegetation cover. The data from 1788 to 2026 tracks a clear trajectory: a city fighting its own geology, expanding horizontally across a heat-prone shale plain because it absence the political to densify its sandstone coast. The result is a basin that is geographically vast functionally fractured, with a density profile that maximizes infrastructure costs and environmental destruction.
Financial Services Dominance and Housing Market Valuation Bubbles
Penal Colony Economics and Rum Corps Corruption (1788, 1810)
The economic identity of Sydney is defined not by its harbour or its beaches, by its aggressive monopolization of credit and the financialization of its residential land. Since the early 19th century, the city has functioned as the primary engine for Australian capital accumulation, a role solidified through specific regulatory decisions and banking charters that concentrated wealth within the Cumberland Plain. This trajectory began in 1817 with the establishment of the Bank of New South Wales ( Westpac) under Governor Lachlan Macquarie. As the bank in the colony, it introduced a formal credit system to an economy previously reliant on promissory notes and barter. This charter did not facilitate trade; it established the precedent that Sydney would be the jurisdiction where debt was issued, managed, and collected.
The dangers of this credit-centric model became clear during the depression of the 1890s. Following a speculative land boom in the 1880s, where property prices in colonial capitals detached from economic fundamentals, the system collapsed. The banking emergency of 1893 saw the suspension or failure of 11 commercial banks, including the Federal Bank of Australia. While "Marvellous Melbourne" suffered the most dramatic fall, Sydney's financial institutions were forced to reconstruct, wiping out shareholder capital and freezing depositor funds. This event imprinted a lasting fear of liquidity crises on the national psyche, yet it paradoxically reinforced the need for a centralized, protected banking sector, eventually leading to the formation of the Reserve Bank of Australia and its permanent placement in Martin Place.
Sydney's modern dominance over Melbourne as the undisputed financial capital arrived with the deregulation era of the 1980s. The decisions made by the Hawke-Keating government to float the Australian dollar in 1983 and invite foreign bank entry in 1985 fundamentally altered the city's commercial. Global institutions seeking an Australian foothold overwhelmingly chose Sydney, drawn by the proximity to the Reserve Bank and the Australian Securities Exchange (ASX). This shift stripped Melbourne of its historic corporate hegemony and concentrated high-income financial services jobs in the Sydney CBD. The influx of global capital required a destination, and increasingly, that destination became the residential housing market.
The transformation of Sydney housing from shelter to a speculative financial asset was not accidental engineered through federal tax policy. The introduction of negative gearing provisions, briefly quarantined in 1985 before being reinstated due to investor pressure, allowed losses on property investment to offset taxes on labor income. This was compounded in 1999 by the Howard Government's introduction of the 50% Capital Gains Tax (CGT) discount. These two method subsidized speculation, encouraging investors to bid up prices in anticipation of capital appreciation rather than rental yield. Sydney, with its geographic constraints and high land values, became the primary beneficiary, and victim, of this tax architecture.
Data from the last five decades illustrates the decoupling of local wages from property values. In 1970, the median house price in Sydney was approximately $18, 700, roughly three to four times the average annual income. By 1990, the median had reached $184, 600. The true acceleration occurred in the 21st century. By 2000, the median sat at $312, 000. Following the post-Olympic boom and the mining investment phase, prices continued to climb, ignoring the global trend of the 2008 financial emergency. By early 2026, industry data places the median Sydney house price between $1. 4 million and $1. 6 million, with forecasts pushing toward $1. 9 million. This represents a valuation multiple that demands dual high-income streams to service the interest, excluding principal repayment.
Sydney Median House Price vs. Inflation & Income (1970, 2026)
Year
Median House Price (Nominal)
Price-to-Income Ratio (Approx.)
Primary Economic Driver
1970
$18, 700
~3. 5x
Post-war industrial expansion
1980
$76, 500
~4. 0x
Inflationary decade
1990
$184, 600
~5. 5x
Financial deregulation boom
2000
$312, 000
~7. 0x
Introduction of CGT discount (1999)
2010
$575, 900
~8. 5x
Post-GFC stimulus & population growth
2020
$1, 000, 000+
~11. 0x
Record low interest rates (COVID)
2026
$1, 600, 000 (Est.)
~13. 0x+
Supply constriction & wealth transfer
The resilience of these valuations during the 2022, 2024 global inflation spike defies traditional economic logic. When the Reserve Bank of Australia aggressively raised the cash rate from 0. 1% to 4. 35%, theoretical models predicted a sharp correction in asset prices. While a minor dip occurred in late 2022, prices in Sydney rebounded and surged to new records by 2025. This anomaly is explained by a severe supply-side absence and the "Bank of Mum and Dad", intergenerational wealth transfer that allows -home buyers to bypass deposit blocks. The market is no longer determined by income, by equity held by previous generations.
This structure has resulted in Sydney households carrying of the highest debt load in the world. As of 2026, Australian household debt stands at approximately 112% of GDP, a ratio second only to Switzerland. The banking sector's exposure to residential mortgages is absolute; the "Big Four" banks (Commonwealth, Westpac, NAB, ANZ) have loan books so heavily weighted toward residential property that a significant correction in Sydney values would constitute a widespread solvency event. The UBS Global Real Estate Bubble Index consistently flags Sydney as "overvalued," noting that while bubble risk fluctuates, the detachment from rental yields and incomes remains a serious structural flaw.
The rental market reflects the downstream consequences of this capital concentration. With yields compressed by high purchase prices, investors demand higher rents to cover mortgage costs, or they exit the market, reducing supply. By 2026, the vacancy rate in Sydney hovered near historic lows of 1%, driving rental inflation that outpaces wage growth. This forces lower-income residents out of the basin entirely, altering the demographic composition of the city. Sydney is becoming a gated community for the financial elite and those who purchased land before the year 2000.
Current forecasts for late 2026 suggest no relief. even with the high cost of borrowing, the chronic undersupply of new dwellings, exacerbated by construction firm insolvencies and labor absence, acts as a floor for prices. The planning systems of New South Wales, frequently criticized for slowness, cannot release land fast enough to meet the demand generated by high immigration. Consequently, the financial services sector and the property market have entered a symbiotic death spiral: banks must keep lending to support asset prices to protect their balance sheets, and buyers must take on ever-larger debts to secure a foothold in a city where land is the only currency that matters.
Transport Gridlock and WestConnex Infrastructure Spending
The of the Sydney tram network stands as one of the most catastrophic urban planning errors in Australian history. Until 1961, the city possessed one of the largest tram systems in the British Commonwealth, second only to London. At its peak in 1945, the network carried 405 million passengers annually across 291 kilometers of track. This infrastructure connected the deep suburbs to the harbour with high-frequency electric rail. Yet, in a decision driven by the post-war idolization of the private automobile and advice from British consultants who viewed rail as an obstruction to traffic, the NSW government systematically destroyed it. The final tram ran on February 25, 1961, from Hunter Street to La Perouse. Following this closure, the rolling stock was not retired; it was hauled to the Randwick workshops, stripped of valuable metal, soaked in oil, and incinerated. This act of industrial vandalism forced a rapidly growing population into private vehicles and diesel buses, setting the stage for six decades of gridlock.
The void left by the trams was filled by an aggressive, car-centric ideology formalized in the County of Cumberland Scheme. This 1948 planning document envisioned a city fed by radial expressways, locking Sydney into a low-density, high-sprawl trajectory. By the turn of the 21st century, this reliance on asphalt had choked the city's economic arteries. In 2025, data from the Bureau of Infrastructure and Transport Research Economics (BITRE) estimated the "avoidable social cost" of congestion in Sydney, measured in lost time, wasted fuel, and environmental damage, had surpassed $10 billion annually. Drivers in the harbour city lose approximately four full days per year sitting in stationary traffic, the highest figure in the nation. The pledge of the open road has collapsed into a reality of brake lights and toll gantries.
To address this self-inflicted emergency, the NSW government embarked on WestConnex, the largest road infrastructure project in the Southern Hemisphere. Originally pitched with a budget of roughly $10 billion, the financial of the project ballooned with a absence of transparency that alarmed auditors. By 2021, the NSW Audit Office revealed that the reported $16. 8 billion budget was a fabrication of accounting convenience. It excluded over $4 billion in directly related costs, such as the "network integration" works required to connect the new tunnels to existing streets. When these off-book expenses are tallied, the true cost of the motorway system exceeds $21 billion. This financial occurred while the government simultaneously sold majority in the project to private interests, privatizing the city's main traffic aorta.
The primary beneficiary of this privatization is Transurban, a toll road operator that holds a near-monopoly on Sydney's orbital network. As of the 2025 financial year, Transurban reported toll revenue of $3. 03 billion, with the Sydney market contributing nearly half of this income. The company's dominance allows it to extract rent from the city's workforce with minimal competition. The "toll mania" of the 2010s resulted in a system where residents of Western Sydney, who frequently absence viable public transport alternatives, pay the highest proportion of their income to access employment hubs in the east. This geographic inequity reinforces the "Latte Line," a socio-economic divide that splits the city between the transit-rich, wealthy north-east and the car-dependent, toll-load south-west.
The engineering execution of WestConnex also faced severe scrutiny, culminating in the Rozelle Interchange disaster of late 2023. Marketed as a direct underground link, the interchange opened to immediate chaos. The complex design, dubbed a "spaghetti junction," confused drivers and created bottlenecks that extended for kilometers. Commuters reported travel times tripling on routes that were supposed to be faster. An inquiry into the debacle in 2024 branded the traffic congestion "unreasonable and unacceptable," citing a failure of the government to model the impact on local surface roads. The inquiry found that the design prioritized the maximization of the asset's sale value over the functional movement of people. For months, residents in the Inner West were trapped in their suburbs, unable to navigate the gridlocked local streets caused by the tunnel's poorly integrated exit ramps.
In response to the escalating cost of living, the Minns government intervened in December 2025 to make the temporary $60 weekly toll cap permanent. This policy, while providing relief to heavy users in suburbs like Blacktown and Baulkham Hills, subsidizes private car use with public funds. To finance this cap, the government announced plans to reintroduce two-way tolling on the Sydney Harbour and Tunnel, ending a decades-long arrangement where southbound trips were free. This shift attempts to redistribute the financial load does not solve the underlying geometry problem: cars are spatially inefficient. The $211 million returned to drivers in rebates since the cap's introduction represents a transfer of wealth from taxpayers to the toll operator, ensuring Transurban's revenue streams remain strong even as the government attempts to shield voters from the pain.
Parallel to the road building frenzy, the Sydney Metro project represents a belated attempt to correct the mistakes of 1961. The City & Southwest line, opening in mid-2024, restored rail capacity through the CBD that had been absent for decades. Yet, the integration of these new driverless trains with the existing, aging heavy rail network remains a challenge. The Metro comes with its own heavy price tag and disruption, yet it offers the only geometric solution to the city's density. By 2026, the contrast between the two systems is clear: the Metro moves tens of thousands of people per hour with high reliability, while the WestConnex tunnels, even with their billions in concrete and steel, remain susceptible to the same induced demand that has plagued every urban highway project since the 1950s.
Sydney Infrastructure & Congestion Metrics (2020-2026)
Metric
Data Point
Context
WestConnex Total Cost
$21 Billion+
Includes $4. 26B in "off-book" integration costs hidden from the official $16. 8B budget.
Transurban Toll Revenue
$3. 03 Billion (FY25)
Sydney network contributes ~49. 5% of total group revenue.
Annual Time Lost
~96 Hours (4 Days)
Average time lost per Sydney driver in congestion (2025).
Congestion Cost
$10 Billion/Year
Economic impact of delays, fuel, and lost productivity in Greater Sydney.
Toll Cap Relief
$60/Week
Permanent cap introduced Dec 2025; funded by two-way Harbour tolls.
Tram Network (1945)
291 km
System destroyed in 1961; modern Light Rail is a fraction of this length.
The Western Harbour Tunnel, slated for completion in 2028, pledge to alleviate pressure on the Harbour and Anzac. Yet, history suggests this is another mirage. The cancellation of the Beaches Link in 2023 demonstrated a rare moment of fiscal restraint, acknowledging that the state could no longer sustain the endless proliferation of tunnel boring machines. By 2026, Sydney exists in a state of transport schizophrenia. It builds world-class metro lines while simultaneously entrenching a private toll road monopoly that incentivizes driving. The ghost of the 1961 tram network haunts every traffic jam on Parramatta Road, a reminder that the city once had the solution, destroyed it, and spent the sixty years paying billions to reinvent the wheel.
Western Sydney Aerotropolis and 2026 Metro Expansion Data
Basin Topography and Urban Sprawl Density Statistics
By March 2026, the Western Sydney International (Nancy-Bird Walton) Airport exists as a physical reality rather than a bureaucratic abstraction. Structural completion of the main terminal was achieved in September 2025, delivered by the Bechtel consortium. The facility, located at Badgerys Creek, sits approximately 44 kilometers west of the Sydney Central Business District. It operates without a curfew, a distinct operational difference from the geographically constrained Kingsford Smith Airport. The federal government invested $5. 3 billion into the project, aiming for an initial capacity of 10 million passengers annually. Cargo operations are scheduled to commence in July 2026, with passenger services following in October 2026. The single 3. 7-kilometer runway, oriented 05/23, is paved and marked, designed to accommodate Code F aircraft including the Airbus A380.
The connectivity of this new infrastructure relies heavily on the Sydney Metro Western Sydney Airport line, a 23-kilometer rail spine costing approximately $11 billion. This fully automated rapid transit system connects St Marys on the existing T1 Western Line to the new Aerotropolis. The line includes six stations: St Marys, Orchard Hills, Luddenham, Airport Business Park, Airport Terminal, and Aerotropolis (Bradfield). While the airport itself met its construction milestones, the rail link faces tighter scheduling pressures. Construction began in December 2022, yet reports from late 2025 indicate a risk that passenger services on the metro line might slip to April 2027, chance forcing the airport to open with bus-only public transport connections. This disconnect highlights a recurring synchronization failure in New South Wales infrastructure delivery, where transit assets frequently lag behind the commercial developments they are intended to serve.
Simultaneously, the broader Sydney Metro network grapples with delays in the City & Southwest sector. The conversion of the T3 Bankstown Line to metro standards, originally targeted for 2024 and then 2025, slipped into 2026. High-speed testing on the Sydenham to Bankstown section only commenced in November 2025. This delay extends the reliance on replacement buses for residents in the Canterbury-Bankstown corridor, eroding public trust in the state's project management capabilities. The integration of these systems is technically complex, requiring the retrofitting of 130-year-old heavy rail corridors with modern platform screen doors and automated signaling systems.
South of the airport terminal lies Bradfield City Centre, as Australia's new major city in over a century. The master plan, approved in September 2024, covers 114 hectares. The " Building," housing the Advanced Manufacturing Readiness Facility (AMRF), opened in March 2025. This structure serves as the anchor for what the government markets as an "advanced manufacturing ecosystem." The strategic intent is to shift professional employment opportunities westward, countering the "latte line" divide that has historically concentrated wealth and high-income jobs in Sydney's north and east. The AMRF sectors such as aerospace, defense, and composite materials, attempting to use the 24-hour operational profile of the adjacent airport.
The financial history of the Aerotropolis land acquisition reveals serious governance failures. The "Leppington Triangle" scandal stands as a permanent mark on the project's ledger. In July 2018, the Department of Infrastructure paid $32. 8 million for a 12. 26-hectare parcel of land owned by the Leppington Pastoral Company. Eleven months later, the department's own financial statements valued the land at $3 million. The Australian National Audit Office (ANAO) described the transaction as unethical, noting that the price per hectare exceeded all reasonable market valuations. While the Australian Federal Police concluded its investigation in 2021 without laying criminal charges, the transaction demonstrated a gross misuse of taxpayer funds. The department paid approximately ten times the market value for land that was already zoned for future airport use, transferring nearly $30 million of public wealth to private entities without justification.
The rezoning process for the broader Aerotropolis precincts in 2020 and 2021 also triggered intense conflict with local landowners. The initial draft precinct plans large swathes of private property as "environmental conservation" or "open space," rendering the land worthless for development while stripping it of its prior agricultural utility. This "green wedge" zoning would have forced landowners to maintain public parkland at their own expense. Following a parliamentary inquiry and significant community backlash, the NSW government was forced to walk back of these designations, yet the volatility of land valuations in the region remains a contentious problem. The Valuer General's reports from 2022 to 2025 show erratic shifts in land values as zoning boundaries were drawn, erased, and redrawn.
The site of the airport itself sits on the unceded lands of the Dharug and Gandangara peoples. The Badgerys Creek area, part of the Cumberland Plain, was managed for thousands of years through specific estate management practices, including controlled burns to maintain open grasslands for hunting kangaroos and wallabies. The colonial displacement of these clans began in the 1790s and intensified with the land grants to settlers like James Badgery. By the mid-1800s, the region was fully enclosed for pastoralism. The erasure of Indigenous land management allowed the dense regrowth of scrub that later settlers mistakenly assumed was the "natural" state of the bush. The 2026 airport construction involved massive earthworks that permanently altered the topography of this ancient, flattening hills and filling creeks to create the level grade required for the 3, 700-meter runway.
The selection of Badgerys Creek for a second airport dates back to 1946, when it was identified as a chance site. yet, political indecision paralyzed the project for seven decades. In 1986, the Federal Cabinet formally selected the site, triggering the release of an Environmental Impact Statement (EIS). This move catalyzed the formation of the "No Aircraft Noise" party, which won a seat in the 1995 NSW state election, demonstrating the potency of noise concerns in Sydney's western suburbs. The project was shelved again in the late 1990s, only to be resurrected by the Abbott government in 2014. The 2026 opening represents the conclusion of an 80-year planning pattern, characterized by federal-state friction and electoral cowardice. The final execution required the federal government to bypass the refusal of the Sydney Airport Corporation (which held the right of refusal) to build the facility, leading to the creation of the government-owned Western Sydney Airport Co.
Western Sydney Aerotropolis & Metro Data (2026 Status)
Metric
Data Point
Airport Cost (Federal)
$5. 3 Billion AUD (Budgeted)
Runway Length
3, 700 meters (Code F capable)
Initial Passenger Capacity
10 Million per annum
Curfew Status
24/7 Operation (No Curfew)
Metro Line Length
23 Kilometers
Metro Stations
6 (St Marys to Aerotropolis)
Leppington Triangle Price
$32. 8 Million Paid (2018)
Leppington Triangle Value
$3. 065 Million (2019 Valuation)
Bradfield City Area
114 Hectares (Core)
Building Opening
March 2025
The environmental impact of the Aerotropolis extends beyond the immediate footprint of the tarmac. The urbanization of the Wianamatta-South Creek catchment threatens the last remaining fragments of the Cumberland Plain Woodland, a serious endangered ecological community. While the "Western Parkland City" marketing pledge a green urban canopy, the data on heat island effects in Western Sydney suggests a different trajectory. The replacement of permeable agricultural land with the impervious surfaces of logistics hubs, runways, and roads exacerbates the extreme heat already common in the Penrith and Liverpool basins, where summer temperatures frequently exceed 45 degrees Celsius. The engineering challenge for 2026 and beyond involves mitigating this heat accumulation in a region that absence the cooling sea breezes of the eastern seaboard.
The 2026 operational readiness of the Western Sydney International Airport forces a realignment of Sydney's logistics chains. Freight operators, restricted by the curfew at Kingsford Smith, are aggressively acquiring industrial land in the Mamre Road precinct. This shift is not about passenger travel; it is a restructuring of the import-export economy of New South Wales. The airport functions as a magnet for high-volume, time-sensitive freight, altering traffic patterns on the M12 Motorway and the widened Northern Road. The economic modeling predicts a surge in logistics employment, yet these jobs frequently differ significantly from the "knowledge economy" roles promised in the Bradfield master plan, creating a chance between the city's aspirational marketing and its industrial reality.
The Latte Line: Socioeconomic Stratification Mapping
The "Latte Line" is not a cartographic curiosity or a social media meme. It is the defining economic fissure of modern Sydney. This invisible boundary runs diagonally northwest from Sydney Airport, cuts through the inner west near Summer Hill, bisects Parramatta, and terminates in the affluent hills of the northwest. To the north and east of this line lies a city of high-income knowledge workers, coastal breezes, and established wealth. To the south and west lies a city of trade workers, intense cultural diversity, thermal inequity, and logistical entrapment. Demographer Bernard Salt popularized the term to describe the concentration of professional employment, yet the divide predates the café culture of the 21st century by nearly two hundred years.
Geography dictated this destiny long before the convict ship arrived. The Sydney basin sits on two distinct geological formations that determined land use from the 1790s onward. The north and east rest on Hawkesbury Sandstone. This rugged, infertile terrain proved useless for early colonial agriculture offered dramatic elevation and harbor views. The south and west sit on Wianamatta Shale. This soil was flatter and richer. It could support crops and livestock. Consequently, the colonial administration pushed the working population, the farms, and later the noxious industries onto the western Cumberland Plain. The wealthy secured the scenic, non-productive sandstone heights. This geological lottery remains the foundation of Sydney's class structure in 2026.
The arrival of the railway in the mid-19th century calcified this separation. The Main Western Line became the artery of industry, transporting goods and workers to the factories of Clyde, Granville, and Silverwater. The North Shore Line, constructed later and with great difficulty across the harbor, became the commuter conduit for the white-collar class. By 1900, the pattern was set. The west was for making things. The north was for managing things. This structural functionalism through the post-war boom. The 1950s saw the rapid expansion of the "fibro belt" in the west, where unsewered suburbs housed the immigrant workforce powering Australia's manufacturing golden age. Gough Whitlam's National Sewerage Program in the 1970s addressed the sanitation emergency, yet it could not reverse the accumulation of asset wealth in the east.
Data from the 2021 Census and projections through 2026 reveal that the line has not blurred. It has hardened. The "Red Rooster Line," a colloquial counter-map coined in 2016, tracks the locations of the fast-food chicken franchise. It aligns with near-perfect precision to the Latte Line. North of the boundary, Red Rooster outlets are virtually non-existent. South of it, they are ubiquitous. This culinary border serves as a proxy for a much deeper in health, education, and capital.
The Sydney Divide: Socioeconomic Metrics (2024-2026)
Metric
North/East ("Latte Zone")
South/West ("Red Rooster Zone")
Bachelor Degree Attainment
65%, 83%
18%, 27%
Median House Price (2025)
$3. 2 Million, $5. 5 Million
$850, 000, $1. 1 Million
Life Expectancy
84. 5 Years
79. 1 Years
Daily Toll Road load
$4. 41 (Harbour )
$25. 00, $39. 00 (M4/M5/M7)
Urban Heat Island Effect
+0°C to +2°C Baseline
+6°C to +10°C above Baseline
The education gap remains the most stubborn predictor of future inequality. In the North Shore council area, over 83 percent of residents complete Year 12. In parts of the Western Parkland City, that figure drops 60 percent. This dictates the labor market. The "knowledge economy" jobs, finance, tech, law, cluster in the CBD and North Sydney. The "essential" jobs, logistics, care, construction, cluster in the west. The COVID-19 pandemic exacerbated this. Residents in the north could work from home. Residents in the west had to travel. Infection rates in 2021 tracked the Latte Line with devastating accuracy.
Infrastructure planning in the 2010s and 2020s attempted to this chasm frequently deepened the financial penalty for western residents. The WestConnex motorway project, completed in stages through 2023, was sold as a time-saver for the west. In practice, it functions as a regressive tax. A return trip from Penrith or Campbelltown to the CBD on the toll network costs a worker upwards of $35 daily. Conversely, a driver from Mosman pays a fraction of that to cross the Harbour. The Minns government introduced a $60 weekly toll cap, yet this relief measure is scheduled to expire on January 1, 2026. If it lapses without replacement, the cost of mobility segregate the western workforce from eastern employment hubs.
Thermal inequality also follows the line. The removal of vegetation for housing developments in the west, combined with the geography of the basin, creates a dangerous heat trap. During summer heatwaves in 2025, temperatures in Penrith and Richmond regularly exceeded those in Bondi and Manly by 10 degrees Celsius. The "cool" east benefits from coastal breezes and established tree canopies. The west suffers from the "heat island" effect generated by black asphalt, dark roofs, and a absence of green cover. This heat stress correlates directly with higher rates of hospital admissions for heat-stroke and cardiovascular failure in western postcodes.
The Greater Sydney Commission ( the Greater Cities Commission) proposed a "Three Cities" model to the monocentric reliance on the CBD. The plan envisions the Western Parkland City (centered on the new Nancy-Bird Walton Airport) as a third economic engine. By 2026, the airport is operational, yet the high-value jobs have been slow to follow. The region risks becoming a logistics hub, a place of warehouses and freight, rather than a center of advanced manufacturing or corporate headquarters. The "digital divide", with internet speeds and digital literacy rates in the southwest lagging behind the fiber-rich north.
Even the "Chicken Line" shows signs of a new commercial apartheid. While the charcoal chicken chain El Jannah, an icon of the west, has successfully expanded into the inner west and north, the flow of capital remains unidirectional. Investment properties in the west are frequently owned by landlords living in the east. The rent flows from the Red Rooster zone to the Latte zone. This wealth transfer ensures that even as property prices rise in the west, the equity gains are frequently harvested by investors living above the line.
The Latte Line is not a static border. It is a moving front of gentrification. Suburbs like Marrickville and Redfern, once firmly south of the divide, have been absorbed into the affluent north. The line pushes further west, displacing low-income residents to the outer fringes of the Cumberland Plain. By 2026, the divide is no longer just about coffee preference or chicken shops. It is about who owns the city and who services it. The sandstone curtain remains as impenetrable as ever.
Harbour Toxicity Levels and Urban Heat Island Metrics
Financial Services Dominance and Housing Market Valuation Bubbles
The hydrological and atmospheric reality of Sydney in 2026 presents a bifurcated emergency: a harbour floor saturated with the industrial sins of the 20th century, and a western plain baking under the asphalt-induced heat of the 21st. The transition from the Eora Nation's sustainable estate management in 1700 to the current toxic baseline represents a catastrophic failure of environmental stewardship. While the surface of Port Jackson glitters for the tourist economy, the sediment profile and the atmospheric data tell a story of persistent contamination and thermal inequality.
The toxicity of Sydney Harbour is not a matter of historical trivia; it is an active, ongoing chemical hazard. Prior to 1788, the harbour's benthic was composed of clean marine sands and silts, supporting a diverse ecosystem of snapper, bream, and crustaceans. By the mid-20th century, the harbour had become the primary drain for unregulated industrial runoff. The most egregious legacy remains the dioxin plume centered on Homebush Bay. Between 1928 and 1976, Union Carbide and its predecessors manufactured chemicals including Agent Orange components on the Rhodes Peninsula. The waste, laden with 2, 3, 7, 8-tetrachlorodibenzo-p-dioxin (TCDD), one of the most potent carcinogens known to science, was used as landfill or discharged directly into the bay.
In 2006, the New South Wales government was forced to implement a total ban on commercial fishing in Sydney Harbour, a prohibition that remains strictly enforced in 2026. This was not a precautionary measure; it was a response to data showing dioxin levels in prawns and bream up to 100 times the safe consumption limit. Remediation efforts between 2005 and 2011 involved capping the most contaminated sediments in Homebush Bay with a of rock and clay. yet, inspections conducted in late 2025 confirm that while the cap remains largely intact, the underlying toxicity has not degraded. The dioxins are hydrophobic and persistent; they do not dissolve, they wait. Consequently, the harbour functions as a "catch-and-release" zone only west of the Sydney Harbour, with dietary advisories warning pregnant women and children to avoid consuming any fish caught east of the. The sediment in Iron Cove, Rozelle Bay, and Blackwattle Bay also contains world-leading concentrations of heavy metals, specifically lead, copper, and zinc, trapped in the black, anoxic sludge that lines the harbour floor.
The chemical profile of Sydney's water took a darker turn in the 2020s with the emergence of Per- and Polyfluoroalkyl Substances (PFAS) as a serious contaminant. Unlike the localized heavy metals, PFAS are mobile "forever chemicals" detected in the broader water catchment. In 2024, extensive testing revealed 31 distinct PFAS compounds in Sydney's tap water, including types previously unrecorded in Australia. The contamination source was traced to the Blue Mountains catchment, specifically the Cascade Water Filtration Plant. By January 2026, Sydney Water had operationalized a $100 million upgrade to the Cascade facility, using granular activated carbon to filter these compounds. Yet, the detection of these chemicals in the blood of residents and the ecosystem proves that the regulatory response lagged decades behind the industrial proliferation of these substances.
While the harbour struggles with chemical toxicity, Western Sydney battles a lethal atmospheric toxicity: heat. The Urban Heat Island (UHI) effect has created a dangerous thermal fissure between the coastal east and the inland west. The geography of the Sydney basin acts as a trap; the cool sea breezes that moderate temperatures in Bondi and Manly rarely penetrate past the inner-west ridge line. West of Parramatta, the forms a shallow bowl that captures hot continental air. This natural topography has been exacerbated by aggressive urban sprawl, characterized by black-roofed housing estates, treeless streets, and vast expanses of concrete.
The data on this temperature is clear. During the Black Summer of 2019-2020, the suburb of Penrith recorded a temperature of 48. 9°C on January 4, 2020, the highest temperature ever recorded in the Sydney basin and, at that moment, the hottest place on Earth. This was not an anomaly a trend line. In the summer of 2025-2026, the continued. On January 10, 2026, while coastal suburbs hovered in the low 30s, Penrith and Richmond again surged past 42. 5°C. The absence of canopy cover is the primary driver. 2025 data indicates that Sydney's urban tree canopy declined by 13. 4% over the preceding five years, with the highest losses concentrated in the very suburbs that can least afford them: Blacktown, Cumberland, and Parramatta.
Table 8. 1: Thermal and Chemical Metrics: Coastal vs. Western Sydney (2020-2026)
Metric
Coastal Sydney (Observatory Hill/Bondi)
Western Sydney (Penrith/Blacktown)
Delta / Impact
Max Recorded Temp (Jan 2020)
~35°C (Coastal breeze effect)
48. 9°C
+13. 9°C (Lethal Gap)
Days> 35°C (2025 Annual)
6 days
41 days
Chronic heat stress exposure
Tree Canopy Cover (2025)
25%, 45% (North Shore/East)
12%, 18% (New developments)
serious loss of shade cooling
Primary Contaminant Risk
Microplastics, Stormwater Runoff
Urban Heat, Ozone, Particulates
Respiratory vs. Heat Stroke
Heat-Related Mortality Risk
Low to Moderate
High (+30% sleep disturbance)
Public health emergency
The human cost of this thermal inequality is measurable in mortality and morbidity statistics. Heatwaves are Australia's deadliest natural hazard, killing more people than bushfires, floods, and storms combined. A 2025 health report found that residents in Western Sydney experienced a 30% higher risk of sleep disturbance and heat stress compared to their eastern counterparts. The "cool night" recovery window, essential for human health, has disappeared in the west due to the thermal mass of concrete retaining heat well into the night. In new developments like Marsden Park, land surface temperatures frequently exceed 50°C, rendering playgrounds and parks unusable during daylight hours.
The intersection of these two crises, toxic water and lethal heat, defines the environmental state of Sydney in 2026. The harbour remains a restricted zone, a beautiful poisoned artifact of the industrial age, where the sediment holds the chemical memory of Union Carbide. Simultaneously, the western suburbs have become a test case for human endurance in a warming climate, where urban planning failures have amplified the sun's intensity. The remediation of the harbour is a century-long project of containment; the cooling of the west requires an immediate and radical reversal of current development standards. Until then, Sydney remains a city divided not just by wealth, by the very air its citizens breathe and the water they cannot touch.
Organized Crime Syndicates and Gangland War Mortality Rates
The genesis of organized crime in Sydney does not begin with street gangs with the colonial government itself. The New South Wales Corps, known notoriously as the "Rum Corps," operated as the region's criminal syndicate between the 1790s and 1810. Officers monopolized the importation of spirits and used rum as a de facto currency to purchase land and labor. This state-sanctioned cartel distorted the early economy and entrenched a culture of corruption that for two centuries. They deposed Governor William Bligh in the Rum Rebellion of 1808 to protect their racketeering interests. This foundational era established a precedent where criminal enterprise and official power frequently intersected. Street-level violence evolved significantly during the late 19th century with the rise of "The Push." These larrikin gangs, specifically the Rocks Push, controlled territory through sheer physical force and mass brawls. Their dominance faded by the 1920s as the "Razor Gangs" emerged in East Sydney. The Pistol Licensing Act of 1927 inadvertently triggered this shift. The legislation imposed severe prison terms for carrying concealed firearms. Criminals adapted by carrying straight razors. These weapons were easily concealed and capable of inflicting horrific, non-fatal wounds. Between 1927 and 1930, police recorded over 500 slashings in the Darlinghurst and Surry Hills areas. Matriarchs Tilly Devine and Kate Leigh managed these violent networks and profited immensely from sly-grog selling and prostitution. The mid-20th century saw the professionalization of Sydney crime under figures like Abe Saffron and George Freeman. This era was characterized by the "glamour" of illegal casinos and the systematic corruption of the NSW Police Force. The Askin government era (1965, 1975) represents the peak of this institutional rot. Police collected graft from illegal gambling dens and protected favored syndicate leaders. The execution of brothel owner Shirley Brifman in 1972 and the disappearance of activist Juanita Nielsen in 1975 highlighted the lethal consequences of challenging this nexus. Violence was targeted and discreet compared to later decades. A brutal shift occurred in the 1990s with the rise of the 5T gang in Cabramatta. Formed by children of Vietnamese refugees, the 5T gang filled the power vacuum in the heroin trade. Their leader, Tri Minh Tran, was only 14 when he rose to power. The gang operated with a disregard for traditional hierarchy and engaged in open street warfare. They were responsible for the assassination of MP John Newman in 1994. This remains the and only political assassination in Australian history. Police intelligence estimates the 5T conflict resulted in over 60 murders during their decade of dominance. The gang dissolved following Tran's murder in 1995 and subsequent police crackdowns. The modern "Postcode Wars" of 2020 to 2024 introduced a new level of public violence. The conflict between the Hamzy and Alameddine families resulted in at least 18 executions in two years. Shootings occurred in broad daylight at public gyms, hair salons, and suburban driveways. The execution of Bilal Hamze in Sydney's CBD in June 2021 marked a serious escalation. Police established Task Force Erebus and later Task Force Magnus to these networks. By March 2024, NSW Police declared the Alameddine network "eradicated" following the arrest of 16 key operatives and the flight of others to Turkey and Lebanon. The of hierarchical families created a fragmented "gig economy" for murder by 2025. Organized syndicates were replaced by loose networks of "contract crews" coordinated via encrypted applications. A police raid in January 2026 exposed a "menu" of criminal services offered to the highest bidder. The price list revealed the commoditization of violence: $1, 000 for assault, $5, 000 for grievous bodily harm, and $10, 000 for arson. Kidnapping services were listed at $6, 000 per day. This "Crime-as-a-Service" model relies heavily on recruiting juveniles. In April 2025, federal police charged a 15-year-old boy in Western Sydney with coordinating international contract killings through an encrypted app. Current mortality data for 2025 and early 2026 indicates a shift from high-profile assassinations to low-cost, high-volume violence. Strike Force Hallet investigations in July 2025 linked a "contract crew" to the murder of Rich Choup and the torture of a man in Canley Vale. The use of disposable, young proxies reduces the risk for masterminds increases the unpredictability of street violence. The professional hitman has been replaced by the amateur teenager. This demographic shift complicates policing efforts as the perpetrators frequently absence prior criminal records or known syndicate affiliations.
Table 9. 1: Evolution of Sydney Criminal Syndicates and Mortality Metrics (1790, 2026)
Immigration Waves and Multicultural Census Analysis (1945, 2026)
Transport Gridlock and WestConnex Infrastructure Spending
The demographic trajectory of Sydney since 1945 represents one of the most rapid and radical population realignments in modern urban history. Following the conclusion of World War II, the Australian federal government recognized that a population of seven million was insufficient for national defense or industrial expansion. Immigration Minister Arthur Calwell established the Department of Immigration in July 1945, operating under the clear manifesto "Populate or Perish." While the initial preference remained strictly British, the absence of available shipping and the reluctance of Britons to emigrate in sufficient numbers forced an immediate policy pivot. Canberra turned to the International Refugee Organization, agreeing to accept displaced persons from war-torn Europe. Between 1947 and 1954, over 170, 000 "Beautiful Balts", refugees from Estonia, Latvia, and Lithuania, arrived, assigned to labor contracts in Sydney's expanding heavy industries. This initial breach of the British-only tradition widened significantly throughout the 1950s and 1960s. The Australian government signed assisted passage agreements with Italy (1951) and Greece (1952), driven by the voracious labor demands of infrastructure projects like the Snowy Mountains Scheme and Sydney's manufacturing belt. By 1961, Italians constituted the largest non-British migrant group, followed closely by Greeks. These arrivals fundamentally altered the inner-city suburbs. Leichhardt, Marrickville, and Newtown transformed from Anglo-Celtic working-class strongholds into high-density Southern European enclaves. Unlike the transient colonial populations of the 19th century, these migrants used "chain migration" methods, sponsoring family members and establishing permanent community structures, including newspapers, soccer clubs, and orthodox parishes, which anchored them to the Sydney basin. The legal of the White Australia Policy occurred in stages, culminating in the Whitlam government's legislative changes in 1973. yet, the practical test of this new non-discriminatory framework arrived with the Indochinese refugee emergency following the fall of Saigon in April 1975. The arrival of the *Kein Giang* fishing boat in Darwin in 1976 forced the Fraser government to formalize a refugee intake strategy. Sydney became the primary recipient of this wave. By 1985, Australia had accepted over 70, 000 Indochinese refugees. In Sydney, this influx centered on Cabramatta and Fairfield, areas near migrant hostels with affordable housing. This concentration created a distinct demographic cluster in South Western Sydney, shifting the city's multicultural center of away from the inner-west and towards the Cumberland Plain. By the 1990s, the focus of Australian immigration policy shifted from family reunion and humanitarian intake to skilled economic migration. The Howard government (1996, 2007) accelerated this transition, decoupling immigration from the concept of "settler arrival" and prioritizing temporary work visas (subclass 457) and international student pathways. This policy pivot coincided with the economic rise of China and India. Consequently, the source countries for Sydney's population growth rotated from Europe to Asia. By the 2011 Census, China and India had begun to challenge the United Kingdom as the primary source of overseas-born residents. This era also saw the emergence of "knowledge worker" enclaves in Parramatta and Ryde, distinct from the manufacturing-based settlements of the post-war era. The 2021 Census delivered a statistical confirmation of this transformation. The data revealed that 43. 2% of Greater Sydney's population was born overseas, a figure significantly higher than the national average of 27. 6%. In specific Local Government Areas (LGAs) such as Cumberland and Fairfield, the overseas-born population exceeded 55%. The top countries of birth for Greater Sydney were Mainland China (4. 6%), India (4. 9%), and England (3. 5%). The data also highlighted a linguistic shift; 42% of Sydney residents spoke a language other than English at home, with Arabic, Mandarin, and Cantonese dominating the western and northern suburbs. This census marked the point where Sydney ceased to be a British outpost in any demographic sense and functioned instead as a global node of Asian-Pacific migration. Post-pandemic migration patterns between 2023 and 2026 intensified these trends to record levels. Following the reopening of international borders, the Albanese government oversaw a surge in Net Overseas Migration (NOM), which reached approximately 528, 000 nationally in the 2022-23 financial year. Sydney absorbed a disproportionate share of this intake, estimated at over 150, 000 new arrivals annually during this peak. This surge was driven primarily by international students and temporary skilled workers filling labor absence. By early 2026, the population of Greater Sydney was estimated to have surpassed 5. 3 million. This rapid expansion placed severe friction on housing stock, driving rental vacancy rates 1% and cementing a political divide between the high-density, migrant-heavy west and the lower-density, established east. The government's response in 2024 and 2025 involved tightening student visa conditions and attempting to cap international enrollments to stabilize the NOM at a target of 260, 000. Even with these corrective measures, the structural reliance of Sydney's economy on migration-driven growth remains absolute. The education export sector, worth billions to the NSW economy, functions as a de facto migration channel. As of 2026, the "Red Rooster Line" (a colloquial demarcation of Sydney's class and ethnic divide) has solidified into a demographic reality: Western Sydney is young, multilingual, and growing, while the Northern and Eastern suburbs remain older and comparatively Anglo-centric.
Table 10. 1: Demographic Evolution of Greater Sydney (1947 vs 2021/2026)
Metric
1947 Census Data
2021 Census Data
2026 Estimate (Projected)
Total Population
~1. 48 Million
5. 23 Million
~5. 31 Million
Born Overseas
~12%
43. 2%
~45. 1%
Dominant Overseas Birthplace
United Kingdom / Ireland
India / China
India
Non-English Speaking Homes
< 2%
42. 0%
~44. 5%
Primary Migration Visa Type
Displaced Persons / Assisted Passage
Skilled / Family Reunion
Student / Temporary Skilled
Key Demographic Hub
Inner City / Eastern Suburbs
Western Sydney (Cumberland/Blacktown)
Western Sydney / Parramatta CBD
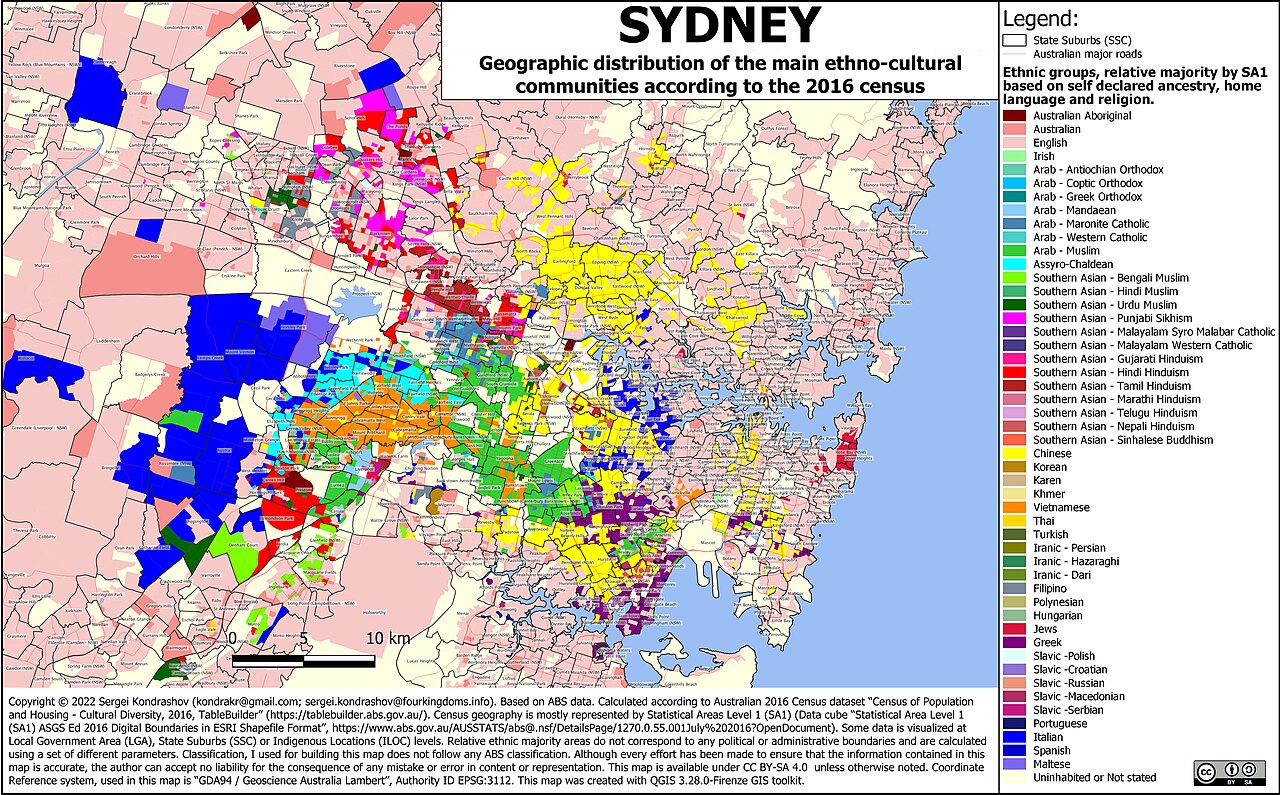
The integration of these waves has not been direct. The "Big Australia" debate continues to fracture political discourse, with infrastructure delivery consistently lagging behind population growth. The 2026 reality is a city of distinct, high-density ethnic precincts connected by an increasingly transport grid. The assimilation model of the 1950s has been replaced by a segmented multiculturalism, where specific suburbs function as self-contained cultural ecosystems. This segmentation is visible in the commercial signage of Hurstville (Chinese), Harris Park (Indian), and Lakemba (Lebanese/Muslim), which serve as the primary commercial and social hubs for their respective diasporas, independent of the traditional Sydney CBD.
Pandemic Response Protocols: 1919 Influenza to 2020 COVID-19
The historical trajectory of pandemic management in Sydney reveals a cyclical pattern of maritime failure, bureaucratic paralysis, and the enforcement of class-based containment strategies. From the arrival of the Spanish Influenza in 1919 to the SARS-CoV-2 breach in 2020, the city's defense method have frequently collapsed at the point of entry, necessitating draconian internal controls that disproportionately target the working-class populations of the Cumberland Plain.
In January 1919, the SS Niagara arrived at North Head Quarantine Station, carrying the viral agent that would soon ravage the city. State authorities, aware of the global devastation, implemented a maritime blockade that theoretically sealed the harbour. Yet, the virus breached these defenses, likely through the movement of quarantine staff or the premature release of contacts. The government response was swift and authoritarian. On January 27, 1919, New South Wales was proclaimed an "infected state." The border with Victoria was sealed, creating a humanitarian emergency at Albury where thousands of travelers were stranded in makeshift camps. Within Sydney, the government mandated the wearing of gauze masks, a requirement enforced by police who patrolled the tram lines and public thoroughfares. Inhalation chambers were established where citizens were forced to breathe a mist of zinc sulfate, a caustic measure with no antiviral efficacy that frequently damaged respiratory tissue.
The 1919 mortality data exposes the clear inequality of the era. By September 1919, the pandemic had claimed approximately 6, 387 lives in New South Wales, with Metropolitan Sydney accounting for 3, 902 of these deaths. The virus did not strike blindly; it followed the contours of poverty. The densely populated slums of Surry Hills, Redfern, and Waterloo suffered mortality rates significantly higher than the leafy enclaves of the North Shore. The "masked city" was a divided city, where the wealthy could isolate in spacious homes while the poor died in overcrowded tenements, their bodies frequently left for days before collection. The failure to support the working population led to a collapse in the labour supply, the post-war economic contraction.
One century later, the arrival of the Ruby Princess on March 19, 2020, demonstrated that the lessons of North Head had been erased from institutional memory. even with clear warnings regarding respiratory illness on board, NSW Health officials permitted 2, 700 passengers to disembark at Circular Quay without testing or quarantine. This single bureaucratic error seeded the virus across the continent, resulting in 662 confirmed cases and 28 deaths linked directly to the vessel. The subsequent inquiry described the handling of the ship as a collection of "serious mistakes," yet the widespread fragility of the port of entry remained the primary vector for the city's infection. The failure at the border once again necessitated the lockdown of the population.
The Delta wave of 2021 precipitated the most aggressive use of statutory police powers in the history of the state. Following a breach in the driver transportation system for international aircrew, the virus spread from the eastern suburbs to the western heartlands. The government response fractured the city into two distinct zones. While the beaches of the east remained relatively accessible, twelve Local Government Areas (LGAs) in Western and South-Western Sydney were as "areas of concern." This classification triggered a militarized containment strategy. For the time in peacetime, the Australian Defence Force (ADF) was deployed to the streets of Bankstown, Fairfield, and Liverpool to assist police in enforcing curfew orders and movement restrictions.
Data from the NSW Bureau of Crime Statistics and Research confirms the in enforcement. Between July and October 2021, residents in the working-class suburbs of Liverpool and Mount Druitt were issued fines totaling over $1 million. In contrast, the affluent suburb of Bondi, where the outbreak originated, saw only $83, 900 in fines during the same period. The "Ring of Steel" erected around Western Sydney prevented residents from leaving their LGAs for work, severing the economic lifeline of the city's essential workforce. Helicopters patrolled the skies over the western plains, broadcasting dispersal orders to empty parks, while construction sites, the primary source of income for in these areas, were forcibly shuttered. The psychological and economic scar tissue from this period remains visible in 2026, manifesting in a deep distrust of state health directives among Western Sydney communities.
The long-term economic consequences of these pandemic responses have reshaped the commercial geography of Sydney. By early 2026, the Central Business District (CBD) had not returned to its pre-2020 density. Office vacancy rates in the CBD hovered between 13. 8% and 14. 8%, a structural shift driven by the permanent adoption of hybrid work models. The "flight to quality" has seen premium towers maintain occupancy while secondary stock languishes, creating a two-tier commercial market. The city center, once the undisputed engine of the state economy, competes with decentralized hubs in Parramatta and the Aerotropolis, a decentralization accelerated by the pandemic's proof-of-concept for remote operation.
The continuity between 1919 and the 2020s lies in the state's reliance on geography as a control method. In both centuries, the government attempted to solve a biological problem with cartographic solutions, drawing lines on a map to contain infection. In 1919, it was the Victorian border; in 2021, it was the "Red Zone" of the Cumberland Plain. This method frequently ignores the fluid nature of a metropolis where labour, logistics, and care networks rigid boundaries. The essential workers of 2021, like the dock workers of 1919, were required to keep the city functioning while being subject to the strictest surveillance. The failure to protect these cohorts at the source, whether through quarantine at North Head or timely vaccination rollout, forced the state to resort to coercion.
By 2026, the legacy of these is a city that is more polycentric yet more socially stratified. The acceptance of digital surveillance, introduced via QR check-ins and vaccine passports, has established a new baseline for state monitoring of citizen movement. The infrastructure of pandemic response has been dismantled, yet the legal precedents for border closures and localized lockdowns remain within the Public Health Act, ready for reactivation. The history of Sydney's pandemics suggests that when the pathogen arrives, it likely enter through a porous maritime or aerial border, and the cost of containment again be extracted from the populations of the western suburbs.
Local Government Amalgamations and State Planning Authority Conflicts
The history of Sydney's governance is a three-century war of attrition between local representation and state-centralized power. Since the incorporation of the City of Sydney in 1842, the boundaries of local democracy have been fluid, frequently redrawn not by the of residents, by the dictates of the New South Wales Parliament. This conflict centers on a single, high- variable: control over land use planning. The trajectory from 1700s colonial administration to the 2026 Transport Oriented Development (TOD) controls reveals a systematic of local voice in favor of state-mandated density and developer efficiency. The major consolidation occurred in the post-war era, driven by the belief that larger administrative units yielded economic efficiency. The *Local Government (Areas) Act 1948* remains the most significant structural shift in the city's history prior to the 21st century. Following the recommendations of the "Three Wise Men" Royal Commission, the state government collapsed 66 municipal councils into 41. This act created the modern boundaries of the City of Sydney by absorbing smaller working-class municipalities like Alexandria, Darlington, Erskineville, Glebe, Newtown, Paddington, Redfern, and Waterloo. The logic was explicitly utilitarian: small councils were deemed incapable of managing the infrastructure demands of a rapidly industrializing metropolis. This 1948 consolidation set the precedent that local identity was secondary to administrative. In 2016, the Baird Coalition government launched the "Fit for the Future" campaign, a bureaucratic offensive designed to force further amalgamations. The state argued that Sydney's 43 metropolitan councils were losing $1 million a day, a figure derived from a confidential report by KPMG. This report, which claimed mergers would generate $2 billion in savings over 20 years, was kept secret from the public and the councils themselves during the consultation period. The resulting forced mergers created mega-councils such as the Inner West Council (Ashfield, Leichhardt, Marrickville), Bayside Council (Botany Bay, Rockdale), and the City of Canterbury-Bankstown. The financial reality of the 2016 amalgamations contradicted the KPMG projections. By 2020, merged councils reported increased operational costs and disharmony rather than the promised. The Inner West Council and Canterbury-Bankstown faced immediate deficits, forcing rate hikes to harmonize the tax bases of their former constituent parts. The democratic deficit was equally severe. Residents in the former Marrickville council, known for its specific progressive character, found their votes diluted in a larger entity. The forced nature of these unions sparked de-amalgamation movements, most notably in the Inner West and by the residents of the former Pittwater Council, who viewed the Northern Beaches Council as a bureaucratic behemoth unresponsive to local environmental concerns. The conflict intensified under the Minns Labor government between 2023 and 2026, shifting from administrative boundaries to direct control over zoning. On January 1, 2024, the state dissolved the Greater Cities Commission (GCC), a body previously tasked with strategic planning across the "Six Cities" region. Its functions were absorbed into the Department of Planning, Housing and Infrastructure (DPHI), removing an independent of oversight and centralizing planning authority directly within the state ministry. This move signaled the end of "strategic partnership" and the beginning of direct intervention. This centralization culminated in the Transport Oriented Development (TOD) State Environmental Planning Policy (SEPP), introduced in May 2024. The policy 37 station precincts across Sydney for mandatory high-density rezoning, stripping councils of their ability to block developments that met state standards. The TOD program imposed a "pattern book" method, permitting residential flat buildings of up to six storeys within 400 meters of stations, regardless of existing local heritage or character controls. Ku-ring-gai Council became the primary antagonist in this new phase of the conflict. In 2024, the Council launched legal proceedings in the Land and Environment Court, challenging the validity of the TOD SEPP. They argued the state had failed to consider the environmental impact on the region's unique Blue Gum High Forest and heritage conservation areas. The standoff represented the most significant rebellion of local government against state planning powers in decades. The resolution of the Ku-ring-gai conflict in November 2025 illustrates the new reality of Sydney's governance. The Council agreed to discontinue its legal challenge after the state accepted an "alternative plan." Under this settlement, Ku-ring-gai retained protection for 80% of its heritage conservation areas was forced to accept the state's housing. The density was not removed redistributed, concentrated heavily around Gordon and Lindfield to spare other precincts. By February 2026, the Minns government finalized similar controls for Penrith, Burwood, and Canterbury-Bankstown, unlocking 31, 000 new homes and bypassing local planning panels entirely. The role of developer influence in these shifts is documented in findings by the Independent Commission Against Corruption (ICAC). Investigations such as Operation Dasha exposed how the unclear interface between councillors and developers in the pre-amalgamation Canterbury City Council led to corrupt planning outcomes. The state government frequently cites such corruption to justify the removal of planning powers from elected councillors and their transfer to state-appointed panels. Yet, this transfer shifts the lobbying focus from the local town hall to the state ministry, replacing retail corruption with wholesale industry influence. The table summarizes the major structural interventions in Sydney's local governance from 1842 to 2026.
Year
Event
Key Metric / Outcome
1842
Incorporation of Sydney City
Establishment of the municipal authority, covering a fraction of the modern basin.
1948
Local Government (Areas) Act
Reduced 66 councils to 41. Created the modern City of Sydney boundaries by absorbing 8 inner-city municipalities.
2016
"Fit for the Future" Mergers
Reduced 43 metro councils to 30. Based on disputed KPMG data claiming $2B savings; resulted in immediate rate hikes.
2024
Dissolution of GCC
Greater Cities Commission abolished Jan 1. Planning powers centralized into the NSW Department of Planning (DPHI).
2024
TOD SEPP Introduction
Mandatory rezoning of 37 station precincts. Stripped council refusal powers for 6-storey flats within 400m of transit.
2025
Ku-ring-gai Settlement
Council dropped legal challenge in Nov 2025. Accepted 3, 300 new dwellings in exchange for heritage protections.
2026
Tier 2 Finalization
Feb 2026: State finalizes controls for Penrith, Burwood, Canterbury-Bankstown, unlocking 31, 000 homes via state override.
The Low and Mid-Rise Housing (LMR) policy, February 2025, further eroded local control by permitting dual occupancies and terraces in low-density zones across the entire Sydney basin. This policy abolished the concept of "single-family zoning" in areas, a change that local councils had resisted for decades. The cumulative effect of the 1948, 2016, and 2024-2026 reforms is the total subordination of the local government area (LGA) to the economic imperatives of the state. The council of 2026 functions less as a local government and more as a service delivery agent for state-determined urban strategy. The capacity for a community to say "no" to development has been systematically dismantled, replaced by a system where they can only negotiate the details of "yes."
Why it matters: China's deliberate economic data blackout is concealing the true state of the world's second-largest economy, impacting global investors, policymakers, and researchers. The blackout extends beyond…
What do we know about Eora Nation Demographics and Displacement Metrics?
The demographic reality of the Sydney basin prior to January 1788 bears no resemblance to the "Terra Nullius" fiction later propagated by colonial courts. The region defined as Greater Sydney was the sovereign territory of the Eora Nation.
What do we know about Penal Colony Economics and Rum Corps Corruption?
The departure of Governor Arthur Phillip in December 1792 triggered an immediate and calculated seizure of economic power by the New South Wales Corps. For the three years, under the interim command of Major Francis Grose and Captain William Paterson, the colony functioned less as a penal settlement and more as a deregulated trading cartel.
What do we know about Basin Topography and Urban Sprawl Density Statistics?
The Sydney Basin's geological reality is a cage of Triassic sandstone and Wianamatta shale that has dictated the city's chaotic urban form since 1788. The basin is not a passive foundation an active constraint; a structural trough bounded by the Blue Mountains to the west, the Hornsby Plateau to the north, and the Woronora Plateau to the south.
What do we know about Financial Services Dominance and Housing Market Valuation Bubbles?
The economic identity of Sydney is defined not by its harbour or its beaches, by its aggressive monopolization of credit and the financialization of its residential land. Since the early 19th century, the city has functioned as the primary engine for Australian capital accumulation, a role solidified through specific regulatory decisions and banking charters that concentrated wealth within the Cumberland Plain.
What do we know about Transport Gridlock and WestConnex Infrastructure Spending?
The of the Sydney tram network stands as one of the most catastrophic urban planning errors in Australian history. Until 1961, the city possessed one of the largest tram systems in the British Commonwealth, second only to London.
What do we know about Western Sydney Aerotropolis and Metro Expansion Data?
By March 2026, the Western Sydney International (Nancy-Bird Walton) Airport exists as a physical reality rather than a bureaucratic abstraction. Structural completion of the main terminal was achieved in September 2025, delivered by the Bechtel consortium.
What do we know about The Latte Line: Socioeconomic Stratification Mapping?
The "Latte Line" is not a cartographic curiosity or a social media meme. It is the defining economic fissure of modern Sydney.
What do we know about Harbour Toxicity Levels and Urban Heat Island Metrics?
The hydrological and atmospheric reality of Sydney in 2026 presents a bifurcated emergency: a harbour floor saturated with the industrial sins of the 20th century, and a western plain baking under the asphalt-induced heat of the 21st. The transition from the Eora Nation's sustainable estate management in 1700 to the current toxic baseline represents a catastrophic failure of environmental stewardship.
What do we know about Organized Crime Syndicates and Gangland War Mortality Rates?
The genesis of organized crime in Sydney does not begin with street gangs with the colonial government itself. The New South Wales Corps, known notoriously as the "Rum Corps," operated as the region's criminal syndicate between the 1790s and 1810.
What do we know about Immigration Waves and Multicultural Census Analysis?
The demographic trajectory of Sydney since 1945 represents one of the most rapid and radical population realignments in modern urban history. Following the conclusion of World War II, the Australian federal government recognized that a population of seven million was insufficient for national defense or industrial expansion.
What do we know about Pandemic Response Protocols: Influenza to COVID-19?
The historical trajectory of pandemic management in Sydney reveals a cyclical pattern of maritime failure, bureaucratic paralysis, and the enforcement of class-based containment strategies. From the arrival of the Spanish Influenza in 1919 to the SARS-CoV-2 breach in 2020, the city's defense method have frequently collapsed at the point of entry, necessitating draconian internal controls that disproportionately target the working-class populations of the Cumberland Plain.
What do we know about Local Government Amalgamations and State Planning Authority Conflicts?
The history of Sydney's governance is a three-century war of attrition between local representation and state-centralized power. Since the incorporation of the City of Sydney in 1842, the boundaries of local democracy have been fluid, frequently redrawn not by the of residents, by the dictates of the New South Wales Parliament.
Why it matters: Global press freedom faces unprecedented challenges, with a significant decline in safety and economic security for journalists. Journalist killings, state-sponsored censorship through imprisonments, and economic…
Why it matters: The collapse of the commercial real estate market in late 2025 was not accidental but a result of a structural liquidity trap that froze global…
Why it matters: Airline monopolies in Africa lead to inflated fares, hindering regional travel and integration. Factors such as lack of competition, protectionism, high taxes, and infrastructure costs…
Why it matters: A significant financial investment of over $200 billion has been made between 2020 and 2025 to enhance the resilience of the U.S. electricity grid. Key…
Why it matters: The quota system in India, aimed at addressing historical inequality, faces challenges in elite institutions like IITs and IIMs. An investigative report reveals discrimination faced…
Why it matters: Khairlanji Massacre: A brutal incident in a small village in Maharashtra where caste hatred led to the horrific murder of a Dalit family. Systemic cover-up:…
Get updates on this place
Get verified alerts when this file is updated (verification required).