
Manor Lands to Longacre Square Carriage Trade 1700, 1903
The intersection recognized as the center of global attention began as a convergence of three streams forming the "Great Kill" in a low-lying wetland. Before the concrete and the neon, this terrain was a rural patchwork of hills and marshes, draining into the Hudson River near present-day 42nd Street. In the 1700s, the land belonged to John Morin Scott, a brigadier general in the New York militia who served under George Washington. Scott's manor house sat near what is 43rd Street, surrounded by horses and farmland. During the American Revolution, this area served as a strategic escape route; General Israel Putnam reportedly used the rural roads here to evade British forces in 1776, a retreat that prevented the total destruction of the Continental Army in Manhattan. The silence of that countryside stands in clear contrast to the decibel levels recorded there today.
The urbanization of this district did not occur through organic settlement through the rigid imposition of the Commissioners' Plan of 1811. This grid system sliced through the topography, disregarding hills and streams to create the rectangular blocks that define modern Manhattan. Yet, the area remained sparsely populated for decades, serving as the northern periphery of a city expanding upward from the Battery. The true architect of its financial future was John Jacob Astor. In a maneuver characterizing his ruthless real estate speculation, Astor acquired a $25, 000 interest in a mortgage on the "Eden Farm," a 22-acre tract covering the future square. When the owner defaulted, Astor foreclosed, seizing control of the land. He did not build; he waited. Astor understood that the city's relentless northward march would eventually turn his mud into gold.
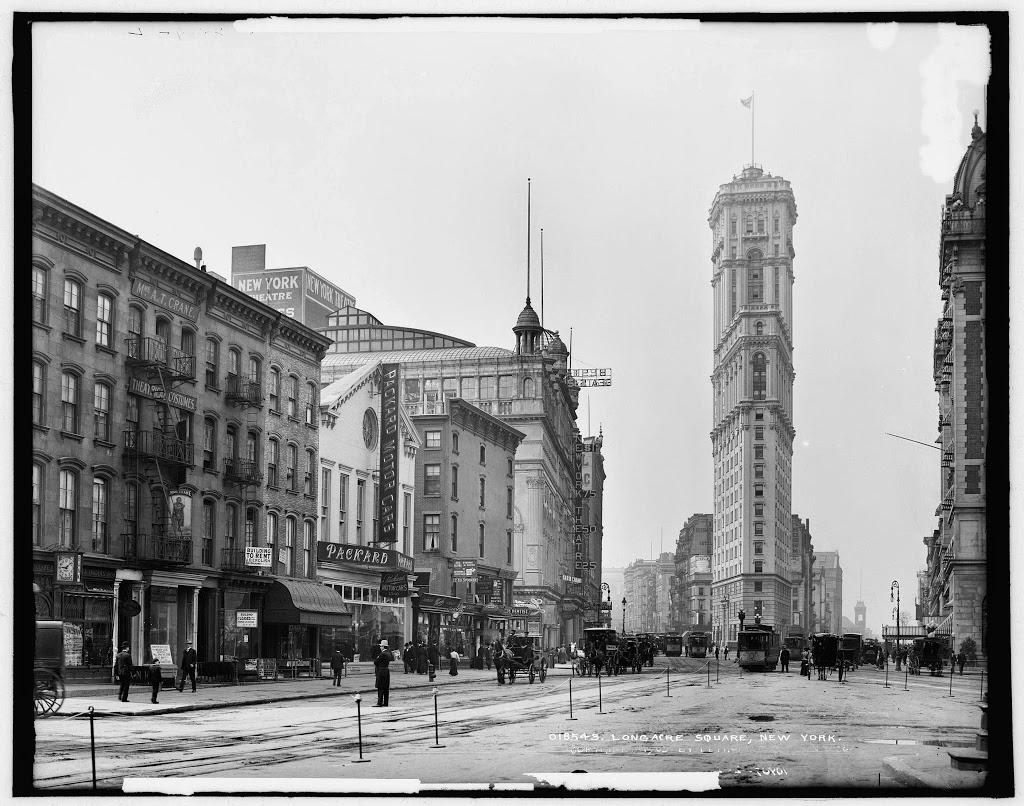
By 1872, the city government recognized the area's growing specific utility and renamed the intersection of Broadway, Seventh Avenue, and 42nd Street as "Longacre Square." The name was a direct nod to Long Acre in London, the center of that city's carriage trade. The designation was accurate. For the three decades, this district functioned as the engine room of New York's horse-drawn transportation network. It was not a place of glamour, of logistics and waste. Stables, carriage repair shops, and blacksmiths dominated the side streets. The sensory reality of Longacre Square in the 1880s was defined by the smell of manure and the clamor of iron on cobblestones. In 1881, William H. Vanderbilt cemented this identity by constructing the American Horse Exchange at 50th Street and Broadway. This massive facility served as the primary market for thoroughbreds and carriage horses, anchoring the trade in the district.
The following table contrasts the metrics of the district during its peak as a carriage hub versus its transition to a transit nexus.
| Metric | Longacre Square (1880) | Times Square (1904) |
|---|---|---|
| Primary Industry | Horse Trading & Carriage Repair | Mass Transit & Journalism |
| Dominant Structure | American Horse Exchange | One Times Square (Times Tower) |
| Transit Mode | Surface Carriage / Horsecar | IRT Subway / Electric Streetcar |
| Lighting | Gas Lamps | Incandescent / Electrified Signs |
| Key Figure | William H. Vanderbilt | Adolph S. Ochs |
While the carriage trade flourished, a darker element festered on the southern edge of the square. The district abutted the "Tenderloin," a notorious zone of vice, gambling, and police corruption frequently called "Satan's Circus." By the 1890s, the crime and prostitution of the Tenderloin began to bleed northward into Longacre Square. The area earned the moniker "Thieves Lair," a place where pickpockets worked the crowds and corrupt officers collected protection money from illicit venues. The brownstones that lined the streets, originally intended for the upper-middle class, frequently converted into brothels or gambling dens as the wealthy moved further uptown to escape the encroaching commercial chaos.
The pivot from horses to entertainment began not with a gradual shift, with a massive, risky gamble by impresario Oscar Hammerstein I. In 1895, he opened the Olympia Theatre, a colossal complex occupying the entire block between 44th and 45th Streets. The Olympia was unlike anything New York had seen; it housed a music hall, a concert hall, a theatre, and a roof garden under one roof. Hammerstein aimed to sanitize the district's reputation and attract the elite. Although the Olympia eventually bankrupted him, it proved that the area could support large- entertainment. It planted the seed for the "Great White Way," a term coined as electric marquees began to replace gas lamps, illuminating the streets with a brilliance that turned night into day.
The definitive death knell for the horse trade and the birth of the modern square arrived with the Interborough Rapid Transit (IRT) Company. Financed by August Belmont Jr., the construction of the city's subway line tore up Broadway from 1900 to 1904. The "cut-and-cover" construction method turned the avenue into a gaping trench for years, disrupting businesses and forcing a physical reconfiguration of the intersection. This engineering marvel required navigating the complex underground hydrology, the legacy of the Great Kill, and blasting through Manhattan schist. The subway promised to deliver hundreds of thousands of people directly to the doorstep of 42nd Street, fundamentally altering the of the real estate above.
Adolph S. Ochs, the publisher who had purchased the failing New York Times in 1896, recognized this impending shift before his competitors. The newspaper was outgrowing its Park Row headquarters, and Ochs saw the chance of the triangle formed by the intersection of Broadway and Seventh Avenue. He purchased the site of the Pabst Hotel and commissioned a steel-framed skyscraper that would dominate the skyline. The Times Tower was an engineering feat in itself, designed with deep sub-basements to accommodate the massive printing presses and a direct connection to the new subway station. Ochs did not want a building; he wanted a monument that would brand the city itself.
Ochs used his political influence to petition the Board of Aldermen for a name change. He argued that the subway station needed a distinct identity, separate from the generic "42nd Street." On April 8, 1904, Mayor George B. McClellan Jr. signed the resolution that officially renamed Longacre Square to Times Square. This was less than a year before the subway opened, yet the rebranding took immediate effect. The carriage trade, already suffering from the advent of the automobile and the electric trolley, was symbolically erased from the map. The American Horse Exchange would soon be converted into a theatre, and the stables would give way to palaces of cinema and stage.
By the end of 1903, the steel skeleton of the Times Tower loomed over a district in chaotic transition. The mud of the 18th-century manor lands had been paved over, the streams buried in sewer pipes, and the horizontal economy of the horse replaced by the vertical ambition of the skyscraper. The stage was set for the 20th century, where this intersection would function not just as a transit node, as the primary aggressive output of American capitalism and media power.
IRT Subway Expansion and the 1904 One Times Square Tower
The transformation of the intersection at 42nd Street, Broadway, and Seventh Avenue from a carriage district into the nerve center of American media was not an organic evolution. It was a calculated industrial maneuver orchestrated by two men: Adolph S. Ochs, the publisher of the New York Times, and August Belmont Jr., the financier behind the Interborough Rapid Transit Company (IRT). In 1903, the newspaper operated out of cramped quarters on Park Row, in the shadow of the New York World and the New York Herald. Ochs required a new headquarters that would physically manifest the paper's rising dominance, yet he absence the capital to build on the expensive plots of lower Manhattan. His solution lay in the route of the upcoming subway line.
August Belmont Jr. had capitalized the IRT with the specific intent of shifting New York's population center northward. The subway was not a transit system; it was a real estate development engine. Ochs identified the triangular plot at the intersection of Broadway and Seventh Avenue, occupied then by the Pabst Hotel, as the ideal command post. The site was awkward, a trapezoid measuring only 58 feet on its southern face and tapering to a mere 20 feet at the north. Architects Cyrus L. W. Eidlitz and Andrew C. McKenzie were tasked with erecting a skyscraper on this geometric sliver. Their design called for a steel skeleton clad in terracotta and brick, rising 25 stories to a height of 363 feet, making it the second-tallest structure in Manhattan upon completion, surpassed only by the Park Row Building.
The engineering challenges at the site were severe. The IRT subway line was designed to curve underneath the building's footprint, creating a direct physical conflict between the city's transport infrastructure and the newspaper's production. Ochs intended the tower to serve as a fully integrated factory, with heavy printing presses located in the basement. To accommodate this, crews excavated 55 feet into the Manhattan schist bedrock. The structural columns of the tower and the subway tunnel had to be threaded past one another with surgical precision. Engineers the foundations of the printing presses from the building's steel frame to prevent the rhythmic thrum of the from shaking the editorial offices above. Conversely, the subway tracks required dampening to ensure the roar of passing trains did not disrupt the typesetters.
On April 8, 1904, the political component of Ochs's plan materialized. Mayor George B. McClellan signed a resolution adopted by the Board of Aldermen to rename Longacre Square to Times Square. This act erased the neighborhood's equestrian identity and branded the municipal map with the name of a private corporation. The resolution also dictated that the subway station under construction at the site would bear the name "Times Square," guaranteeing the newspaper millions of brand impressions annually. The New York Times reported the change the following day with feigned modesty, claiming the name "Longacre" meant nothing to the modern citizen. In reality, the renaming was a masterstroke of corporate branding that permanently fused the identity of the location with the newspaper.
The Interborough Rapid Transit Company opened its main line to the public on October 27, 1904. The system ran from City Hall to 145th Street, with the Times Square station serving as a pivotal node. On that day, 150, 000 passengers paid the five-cent fare to ride the trains. The impact on the surface was immediate. The subway disgorged thousands of people directly at the doorstep of the unfinished Times Tower, turning the intersection into a high-density pedestrian zone almost overnight. Real estate speculators, anticipating the flood of traffic, had already begun buying up adjacent lots, driving prices from the carriage-trade era lows to speculative highs. The subway connection validated Belmont's investment and secured Ochs's gamble.
By late 1904, the Times Tower stood as a neo-Gothic spike in the midtown sky. Its height was deceptive; the narrow floor plates meant that the building contained relatively little usable office space. It was, in essence, a habitable billboard. The true value lay in its visibility and its basement production capacity. The New York Times moved its operations into the building in January 1905, Ochs orchestrated the public inauguration for New Year's Eve, December 31, 1904. He sought to lure the holiday crowds away from Trinity Church in Lower Manhattan, which had long held the city's primary celebration.
Ochs arranged for a pyrotechnic display to be launched from the roof of the new tower. At midnight, dynamite charges were detonated, and fireworks illuminated the steel frame of the building, visible for miles across the darkened city. A crowd estimated at 200, 000 people packed the streets, their faces upturned toward the headquarters of the New York Times. The sound of the explosion signaled more than the new year; it marked the transfer of New York's social and commercial from the financial district to Midtown. The tradition of the ball drop would not begin until 1907, the ritual of gathering at Times Square was forged in the gunpowder smoke of that night.
The operational reality of the Times Tower was intense. Deep in the sub-basement, the Walter Scott & Co. presses churned out thousands of papers per hour. The finished editions were moved via conveyors directly to the subway level or to street trucks for distribution. This logistical integration gave the Times a speed advantage over its competitors. The building itself became a living machine, vibrating with the dual energies of the subway and the presses within. The "Times Square" designation, initially a convenience for transit mapping, rapidly became a global synonym for the intersection of news, commerce, and spectacle.
| Metric | Value / Detail |
|---|---|
| Date of Name Change | April 8, 1904 (Resolution signed by Mayor McClellan) |
| Subway Opening Date | October 27, 1904 (IRT Main Line) |
| Day Subway Ridership | 150, 000 passengers (system-wide) |
| Times Tower Height | 363 feet (395 feet including flagpole) |
| Stories | 25 above ground, 3 ground |
| Excavation Depth | 55 feet into bedrock |
| NYE 1904 Attendance | 200, 000 (Estimated) |
| Subway Fare | $0. 05 |
The success of the IRT station at 42nd Street fundamentally altered the economic physics of the area. Hotels like the Knickerbocker and the Astor rose in rapid succession to capitalize on the transit-fed foot traffic. The carriage trade, already in decline, entirely, replaced by a frenetic automotive and pedestrian chaos. The New York Times had not just built a headquarters; it had anchored a new central business district. The symbiotic relationship between the subway and the skyscraper defined the development pattern of 20th-century New York, proving that density could be manufactured through the strategic alignment of heavy infrastructure and corporate.
Even with the immediate success, the Times Tower's utility as a newspaper headquarters was short-lived. The physical constraints of the triangular lot eventually strangled the paper's expanding operations. The very success of the newspaper, fueled by its high-profile location, forced it to outgrow the tower within a decade. Yet, in 1904, the building was the absolute apex of modernity. It stood as a steel-and-stone declaration that the center of the world had moved north, and that the future would be written in the ink of the New York Times and carried on the rails of the IRT.
Neon Signage Regulations and Electric Consumption 1910, 1940
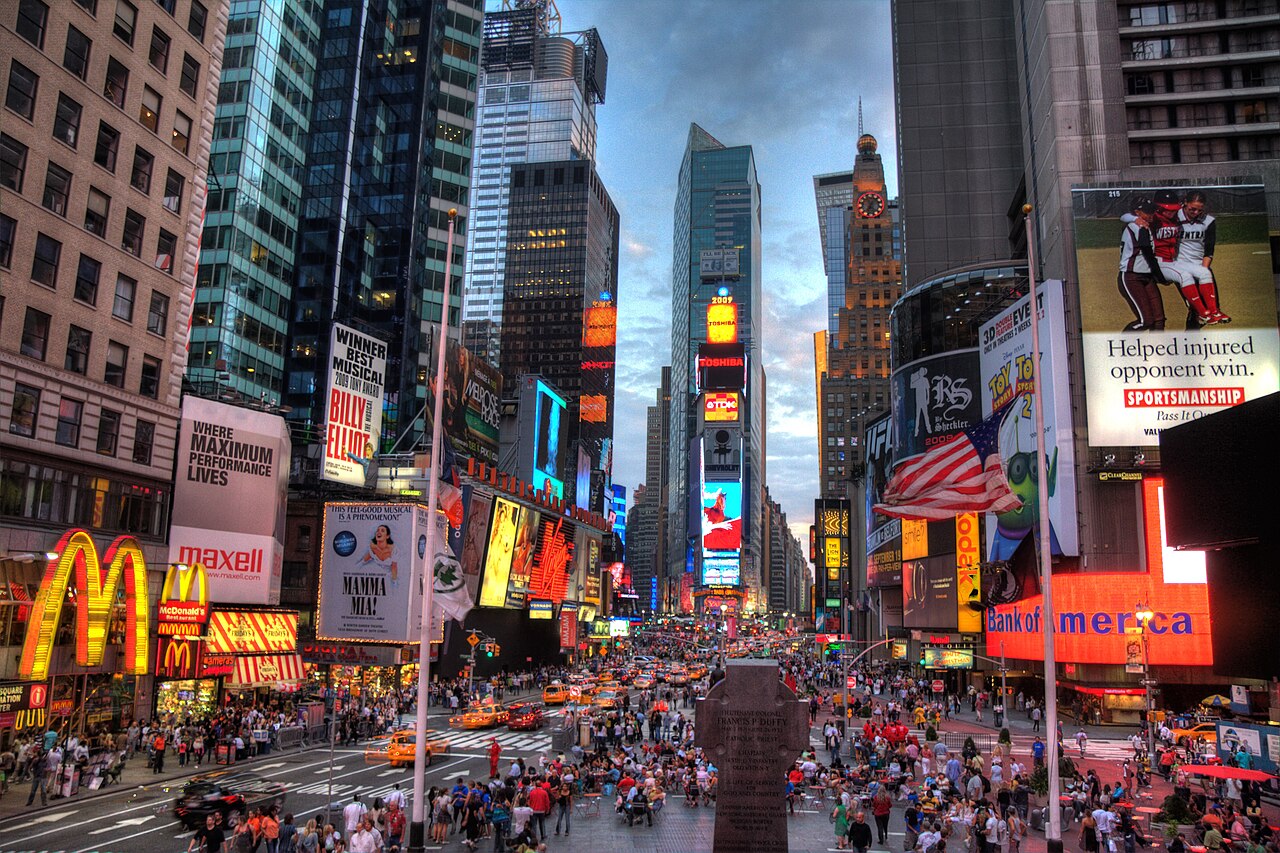
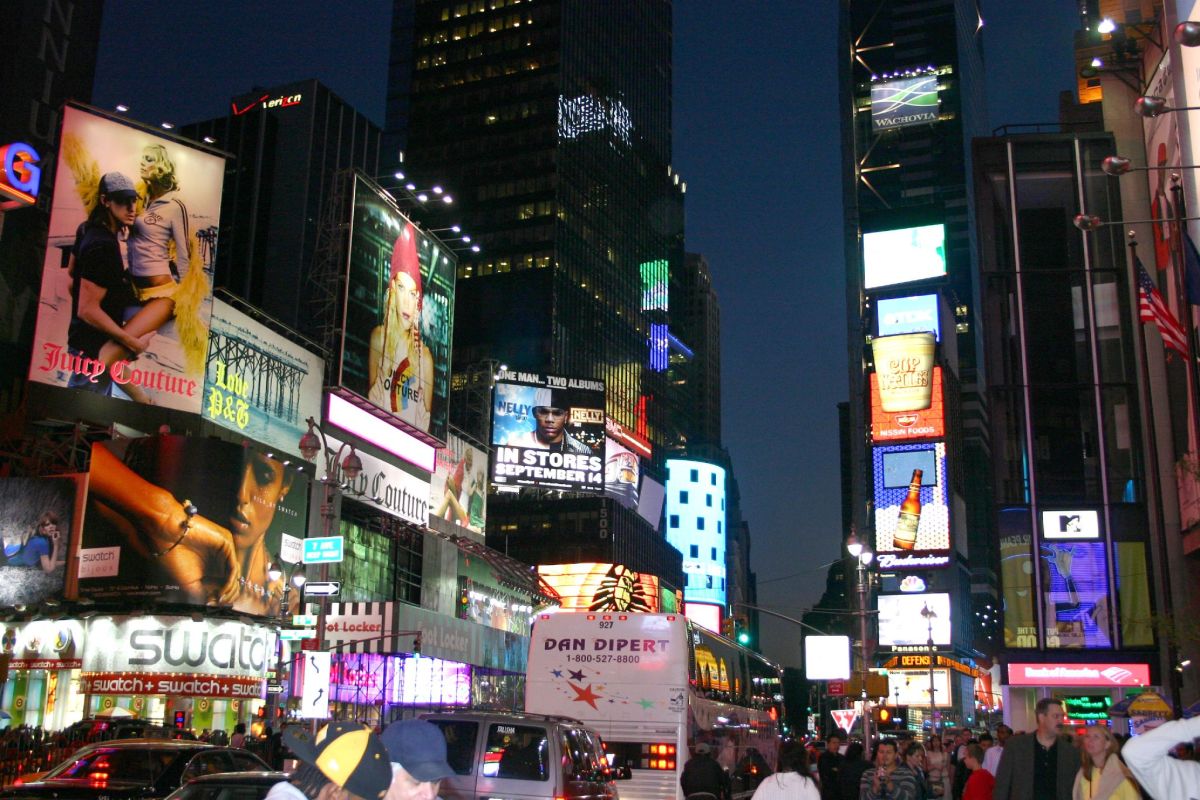
The transformation of Times Square from a carriage district to an electric cathedral was not an accident of organic growth. It was a calculated industrial operation led by O. J. Gude, an advertising magnate who recognized that light itself was a commodity. By 1910, Gude had seized control of the most visible rooftops in the district. He engineered the "Spectacular," a classification of signage defined by the industry as a display using more than 200 square feet of surface area and possessing complex animation. The 1917 Wrigley Spearmint Gum sign serves as the primary data point for this era. Located between 43rd and 44th Streets, this structure spanned 200 feet in length and 50 feet in height. It required 17, 000 incandescent bulbs to function. The operational cost was. Records indicate the rental price for this single rooftop position reached $9, 000 per month in the 1920s, a figure that adjusts to over $160, 000 in 2026 currency.
The incandescent era imposed severe physical and electrical loads on the district. These signs were not visual overlays. They were heavy industrial. The steel superstructures required to support tons of glass and copper wiring demanded reinforcement of the buildings beneath them. Heat generation was a serious problem. A sign with 15, 000 to 20, 000 bulbs produced enough thermal energy to alter the microclimate of the street during summer months. Maintenance crews worked nightly shifts to replace burned-out filaments, a labor-intensive process that kept the "Great White Way" functioning. The Consolidated Edison Company (then New York Edison) observed a spike in localized grid demand that rivaled the industrial zones of Brooklyn. Times Square became a distinct load center on the Manhattan grid, consuming electricity at a rate that outpaced the residential boroughs combined.
Regulatory intervention arrived with the 1916 Zoning Resolution. This legal framework is frequently as the tool that saved the district's chaotic aesthetic by quarantining it. The Fifth Avenue Association, representing the city's elite retail interests, successfully lobbied to ban illuminated projecting signs on their own thoroughfare. They viewed electric advertising as vulgar. The 1916 code pushed all large- illuminated advertising into the theater district. Times Square became the containment zone for high-voltage commerce. This legislation did not restrict the signs in Times Square. It protected them. By outlawing competition in other zones, the city guaranteed that national brands had to compete for the limited visual real estate along Broadway and Seventh Avenue.
| Sign / Brand | Year | Technology | Key Metric |
|---|---|---|---|
| Wrigley Spearmint | 1917 | Incandescent Bulb | 17, 000 bulbs, $100, 000 construction cost |
| Willys-Overland | 1924 | Neon (Claude Patent) | neon spectacular in district |
| Chevrolet Clock | 1930s | Incandescent/Neon Hybrid | Most accurate time-check in NYC |
| Wrigley Marine Garden | 1936 | Neon Tube | 42-foot animated neon fish |
The arrival of neon gas changed the physics of the street. In 1924, the Willys-Overland automobile company installed the neon spectacular in Times Square. The technology came from Georges Claude, a French engineer who had patented the method of capturing rare gases in glass tubes. Neon offered a lethal advantage over the incandescent bulb: it was cold light. It consumed a fraction of the electricity and produced almost no heat. The visual output was also superior. Neon cut through the fog and rain that frequently obscured bulb-based signs. The "liquid fire," as the press described it, allowed for continuous lines of light rather than the dotted-line effect of individual bulbs. This shift lowered the barrier to entry for advertisers and increased the density of photons hitting the pavement.
The Great Depression did not dim the lights. It intensified the competition for eyes. As consumer spending collapsed after 1929, brands used Times Square as a desperate megaphone. The 1930s saw the installation of the Wrigley Marine Garden in 1936, a massive neon aquarium that replaced the earlier bulb-based spearmen. This sign featured fish as large as 42 feet swimming through a sea of electric blue. The complexity of the timing method increased. Elevators behind the signs housed banks of mechanical switches and relays, the analog precursors to digital servers. These rooms were loud, hot, and filled with the ozone smell of arcing electricity. The sign industry became a serious employer during the economic downturn, requiring armies of glassblowers, sheet metal workers, and electricians.
Safety regulations struggled to keep pace with the vertical expansion. The Department of Buildings enforced strict codes regarding wind load. A falling letter from a spectacular could kill a pedestrian instantly. Engineers had to account for the wind tunnel effect created by the canyon of skyscrapers. Signs were bolted into the structural steel frames of the host buildings. The 1938 Building Code revision specifically addressed the "combustible materials" used in sign facings, forcing a move toward more fire-resistant metals and glass. This period also saw the rise of the "zipper" news ticker on the Times Tower, which launched in 1928. It used 14, 800 bulbs to transmit data, turning the building itself into a transmission device. The electricity required to run the zipper alone was enough to power a small hamlet.
By 1940, the electric consumption of Times Square had become a statistical anomaly. The district burned more coal-generated power for advertising than American cities used for all municipal services. This excess drew criticism from conservationists and urban planners who saw it as waste. Yet the economic data silenced the critics. The foot traffic generated by the lights sustained the theaters, the restaurants, and the retail shops. The light was the economy. The 1916 zoning decision to concentrate the glare had created a self-sustaining ecosystem where electricity was directly converted into revenue. This unchecked consumption continued until the looming threat of war in Europe forced the city to consider the strategic liability of a beacon visible from the Atlantic Ocean.
Mid-Century Vice Economies and Peep Show Proliferation 1960, 1985
By the early 1960s, the carriage trade that once defined Longacre Square had, replaced by a new economic engine built on the commodification of vice. The grand theaters, originally constructed to host the likes of the Ziegfeld Follies, faced a clear reality: the suburban flight of the middle class and the ascendancy of television had decimated ticket sales. Property owners, desperate to cover the high taxes on their prime Manhattan real estate, turned to a new class of tenant. The transformation was not gradual industrial in its efficiency. Between 1960 and 1975, the area bounded by 40th and 54th Streets and 6th and 8th Avenues devolved into a containment zone for the illicit, a shift driven by the specific mechanics of the "peep show" loop.
The architect of this new economy was Martin Hodas, a former vending machine operator who would come to be known as the "King of the Peeps." In 1966, Hodas acquired modified Panoram machines, devices originally designed in the 1940s to play "soundies" or music videos in bars. Hodas recalibrated the internal projectors to loop 16mm pornographic films. He installed the bank of these machines in a bookstore on West 42nd Street. The financial returns were immediate and. A single machine, occupying less than four square feet of floor space, could generate hundreds of dollars a day in quarters. By 1968, Hodas was reportedly depositing $15, 000 in coins daily, equivalent to over $130, 000 in 2026 currency, into the Chemical Bank branch at Eighth Avenue and 42nd Street. The sheer weight of the quarters required armored trucks for transport, marking the physical manifestation of the district's new liquidity.
The success of the Hodas model triggered a proliferation of "adult" establishments. By the late 1970s, municipal surveys recorded approximately 140 sex-oriented businesses in the Times Square district. These included bookstores, "live" shows, and grindhouse theaters. The New Amsterdam Theatre, once the jewel of 42nd Street where the Ziegfeld Follies premiered, had been reduced to a hollow shell, its Art Nouveau interior rotting while kung fu movies and softcore pornography played on its screen to sleeping transients. The economics of the grindhouse relied on volume and low overhead; operators ran films 24 hours a day, allowing patrons to sleep in the seats for the price of a ticket, creating a de facto shelter system that further alienated the traditional theater-going public.
West of the theaters, Eighth Avenue between 42nd and 50th Streets earned the grim moniker "The Minnesota Strip." This stretch became the epicenter of street prostitution, named for the high number of teenage runaways who arrived at the Port Authority Bus Terminal from the Midwest and were immediately absorbed into the local sex trade. The ecosystem here was predatory and highly organized. Pimps and traffickers operated with near impunity, protected by a widespread collapse in law enforcement integrity. The close proximity of the bus terminal to the vice district created a pipeline of labor that fueled the economy of the strip, a dark inversion of the area's history as a transportation hub.
The proliferation of vice was enabled by the "pad", a widespread bribery network within the NYPD exposed by the Knapp Commission in the early 1970s. Officers in the Midtown South and Midtown North precincts were categorized by the commission as either "meat-eaters" (who aggressively solicited bribes) or "grass-eaters" (who accepted payoffs when offered). The corruption allowed gambling dens, unlicensed bars, and brothels to operate openly. In 1970, the NYPD headcount stood at roughly 32, 000 officers. Yet, the fiscal emergency of 1975 forced the city to lay off thousands of police and firefighters, reducing the force to under 22, 000 by the early 1980s. This 30% reduction in manpower coincided with the rise of the vice economy, leaving the district self-regulated by organized crime families, primarily the Gambino and Genovese syndicates, who controlled the distribution of pornography and the real estate leases.
The nadir of this era was culturally codified in 1975 when the Council for Public Safety, a union coalition protesting the layoffs, distributed pamphlets to tourists titled "Welcome to Fear City." The guide explicitly warned visitors to stay off the streets after 6: 00 PM and to avoid public transport. This was not hyperbole; felony assault and robbery rates in the Midtown South precinct surged. The vacuum of authority allowed Richard Basciano to succeed Hodas as the dominant figure in the district. In 1977, Basciano opened the Show World Center at 669 Eighth Avenue. Spanning 22, 000 square feet and four stories, it was described as the "McDonald's of Sex." Unlike the dingy storefronts of the 1960s, Show World was a vertically integrated entertainment complex, featuring live burlesque, peep booths, and adult retail, generating millions in untaxed or laundered revenue annually.
| Metric | 1970 Status | 1980, 1985 Status | Impact on District |
|---|---|---|---|
| NYPD Manpower | 32, 000 Officers | <22, 000 Officers | Loss of beat patrols; rise in open-air drug markets. |
| Adult Businesses | ~45 Establishments | ~140 Establishments | Real estate values plummeted; legitimate retail fled. |
| Vice Revenue | Est. $20M/year (adj.) | Est. $1. 2M/week (gross) | Cash-based economy fueled organized crime control. |
| Violent Crime | High (Robbery focus) | Severe (Homicide/Assault) | Tourism collapsed; "Fear City" reputation solidified. |
By 1980, the character of the crime shifted again with the introduction of crack cocaine. The drug markets, previously focused on heroin and marijuana, became more volatile and violent. The "Deuce", the slang term for 42nd Street, became a corridor of open-air transactions. The architectural legacy of the area, from the Knickerbocker Hotel to the Paramount Building, served as a backdrop for a dystopian streetscape. The intricate terracotta facades of the 1920s were obscured by massive, garish signage advertising "Live Nude Girls" and "25 Cent Peeps." The physical degradation of the buildings mirrored the social collapse; landlords refused to invest in maintenance, knowing that their vice-peddling tenants required only electricity and darkness to operate.
The 1980s also saw the beginning of the end for this era, though the transition was violent. The 42nd Street Development Project, initiated by the state and city in the early 80s, began the slow, litigious process of condemning properties to break the hold of the vice landlords. Yet, in 1985, the district remained a dangerous, high-cash economy. The land that John Morin Scott had farmed in the 1700s, and that had served as a glamorous carriage district in the 1890s, had become the most notorious red-light district in North America. The peep show token, a simple brass slug, had replaced the theater ticket as the primary currency of the crossroads, representing a complete inversion of the area's intended purpose as a center of culture and commerce.
State Zoning Laws and the 42nd Street Development Project 1980, 1995
By 1980, the block of 42nd Street between Seventh and Eighth Avenues, known colloquially as "The Deuce", had devolved into a containment zone for illicit commerce. Police statistics from 1984 recorded 2, 300 crimes on this single block, 20 percent of which were felonies including rape and murder. The area generated only $6 million in property taxes for the city, a figure dwarfed by the cost of policing it. The collapse of the area's social order forced city and state officials to abandon standard urban planning methods in favor of aggressive intervention. The instrument for this upheaval was the New York State Urban Development Corporation (UDC), an agency with the power to condemn private property and bypass local zoning restrictions.
The legal framework for the redevelopment began with a 1980 Memorandum of Understanding between Mayor Ed Koch and the UDC. This agreement marked a shift from municipal zoning enforcement to state-level eminent domain. The city acknowledged it could not clear the "blight", a specific legal designation required to seize property, without the UDC's extraordinary powers. In 1984, the Board of Estimate approved the 42nd Street Development Project (42DP), which targeted 13 acres of midtown real estate. The plan called for the demolition of low-rise structures to make way for four massive office towers designed by Philip Johnson and John Burgee, totaling 4. 1 million square feet.
Parallel to the UDC's specific project, the City Planning Commission enacted the Special Midtown District in 1982. This zoning resolution fundamentally altered the density map of Manhattan. It reduced the allowable Floor Area Ratio (FAR) on the congested East Side while increasing it on the West Side, using zoning bonuses to shove development toward Times Square. Developers received density bonuses for preserving legitimate theaters, a method intended to save the historic playhouses from the wrecking ball while allowing the construction of skyscrapers above or beside them. This zoning manipulation aimed to sanitize the district by flooding it with corporate office workers.
The execution of the 42DP faced immediate and ferocious resistance. Existing property owners and rival developers, notably the Durst Organization, filed 47 separate lawsuits to halt the condemnation proceedings. These legal battles stalled the project for nearly a decade. During this delay, the 1987 stock market crash decimated the demand for office space, rendering the plan for the Johnson/Burgee towers economically unviable. The site remained a frozen conflict zone: the state had the legal right to seize the land, the developer, Park Tower Realty (led by George Klein) and later Prudential Insurance, had no tenants to fill the proposed buildings.
By the early 1990s, the failure of the "office park" concept forced a strategic pivot. Architects and planners, including Robert A. M. Stern, argued that sterilizing Times Square with gray glass monoliths would destroy the very character that made the location valuable. In 1992, the "42nd Street!" plan emerged. This new set of design guidelines rejected the modernist urge to tidy up the chaos. Instead, it mandated " ", requiring new developments to incorporate massive illuminated signage, minimum lighting levels, and retail transparency. The zoning code was weaponized to enforce spectacle; buildings were not just permitted to have neon signs, they were legally required to cover their facades with them.
The turning point for the project, and the moment that cemented the transition from pornography to family entertainment, was the negotiation with the Walt Disney Company in 1993 and 1994. Disney CEO Michael Eisner expressed interest in the dilapidated New Amsterdam Theater demanded favorable terms to mitigate the risk of entering a high-crime zone. The state agreed to a deal that critics described as a giveaway and supporters called a necessary loss leader. The UDC provided a $21 million loan to Disney at a subsidized interest rate of 3 percent. Disney committed only $8 million of its own capital upfront to restore the theater. This agreement served as the signal to the market that the state's purge of the sex industry was permanent.
| Year | Event | Significance |
|---|---|---|
| 1980 | City/UDC Memorandum of Understanding | Established state power to use eminent domain in Times Square. |
| 1982 | Special Midtown District Zoning | Shifted density allowances (FAR) from East Side to West Side. |
| 1984 | Board of Estimate Approval | Authorized the 42DP; the area as "blighted." |
| 1984-1989 | The Litigation Phase | 47 lawsuits filed by property owners and the Durst Organization delay condemnation. |
| 1990 | State Acquisition | UDC completes condemnation of 34 properties, becoming the landlord of "The Deuce." |
| 1992 | "42nd Street!" Guidelines | Robert A. M. Stern's plan shifts focus from office towers to entertainment/retail. |
| 1994 | Disney Agreement | State grants $21M low-interest loan; Disney leases New Amsterdam Theater. |
| 1995 | New Amsterdam Lease Signed | Marks the official entry of corporate entertainment conglomerates. |
The arrival of Disney triggered a cascade of investment. With the anchor tenant secured and the "blight" legally cleared via condemnation, the 42nd Street Development Project moved from litigation to construction. The zoning requirements for high-wattage signage ensured that the new Times Square would not resemble the sterile canyons of Sixth Avenue. Instead, the regulations codified a commercial aesthetic that monetized attention. The cleanup was absolute; between 1990 and 1995, the state used its ownership of the condemned properties to evict the adult bookstores and peep shows, leaving the storefronts vacant until corporate tenants could be signed. The "Deuce" was dead, replaced by a state-curated entertainment district designed to maximize revenue per square foot.
Pedestrian Plaza Implementation and Traffic Flow Data 2009, 2017
The initial implementation was crude. The Department of Transportation (DOT) scattered hundreds of folding lawn chairs across the closed lanes, creating a surreal visual of leisure in the center of Manhattan's densest commercial district. even with the makeshift aesthetics, the data generated during this pilot proved decisive. GPS data from 2009 and 2010 showed that taxi speeds on northbound avenues actually increased by 17 percent, while injuries to motorists fell by 63 percent and pedestrian injuries dropped by 35 percent. Foot traffic in the square surged, with 80 percent fewer pedestrians forced to walk in the roadway. By February 2010, the city declared the closure permanent, setting the stage for a massive infrastructural overhaul.
Between 2012 and 2017, the Norwegian architecture firm Snøhetta led a $55 million reconstruction project to replace the temporary paint and epoxy with permanent materials. The design, known as the "Bowtie," unified the fragmented traffic islands into a ground plane. Workers tore up the street to install dark precast concrete pavers with nickel-sized steel discs, designed to capture and reflect the neon glow of the billboards above. The project also addressed the subterranean reality of the square, upgrading century-old sewer and electrical lines. Above ground, ten granite benches, ranging from 30 to 50 feet in length, were installed. These were not seating; they contained fiber-optic cables and power sources to support events, eliminating the need for diesel generators that had previously choked the air during concerts and New Year's Eve celebrations.
The physical transformation, yet, birthed a new emergency of public order. By the summer of 2015, the newly liberated pedestrian space had attracted a density of aggressive panhandlers and costumed characters. The tabloid press fixated on "desnudas", women wearing only body paint and thongs who solicited tips for photos, as well as aggressive individuals in Elmo and Spider-Man costumes who harassed tourists. The situation to the point where Police Commissioner William Bratton and Mayor Bill de Blasio publicly floated the idea of ripping up the plaza and returning the lanes to vehicular traffic to disperse the crowds. This proposal met with fierce resistance from urban planners and the Times Square Alliance, who argued that the safety and economic gains were too valuable to discard.
The city's response was a regulatory zoning experiment implemented in June 2016. The City Council passed legislation granting the DOT power to regulate activity within pedestrian plazas. On the night of June 8, 2016, workers painted eight " Activity Zones" (DAZs) on the pavement in a color officially described as "Techno Teal." These 8-by-50-foot boxes became the only legal areas for commercial solicitation, including costumed characters and ticket sellers. The rest of the plaza was as "Pedestrian Flow Zones," marked with white tape, where stopping to solicit was prohibited. This zoning regime broke the siege of aggressive panhandling without removing the pedestrian space itself.
By the official completion of the Snøhetta project in April 2017, the metrics of Times Square had shifted permanently. Daily pedestrian volumes stabilized between 330, 000 and 450, 000 people, making it one of the most trafficked pedestrian areas on Earth. The economic were equally clear. With the plaza permanent and the chaos regulated, retail values soared. In the spring of 2015, ground-floor asking rents in the Times Square "Bowtie" averaged $2, 413 per square foot, a figure supported by the guarantee of massive, slow-moving foot traffic. The 2009-2017 period proved that removing cars did not kill commerce; it supercharged it by prioritizing the biological speed of the human wallet over the mechanical speed of the automobile.
| Metric | Pre-Plaza / Early Pilot (2008-2009) | Post-Implementation (2016-2017) |
|---|---|---|
| Daily Pedestrian Volume | ~350, 000 (Peak) | ~450, 000 (Peak) |
| Motorist Injuries | Baseline | -63% |
| Pedestrian Injuries | Baseline | -35% |
| Retail Asking Rent (Ground Floor) | ~$1, 000, $1, 500/sq ft (Est.) | ~$2, 413/sq ft (2015 REBNY Data) |
| Public Space Acreage | 0 Acres (Traffic Lanes) | 2. 5 Acres (Pedestrian Only) |
Digital Billboard Revenue and LED Screen Density 2010, 2025
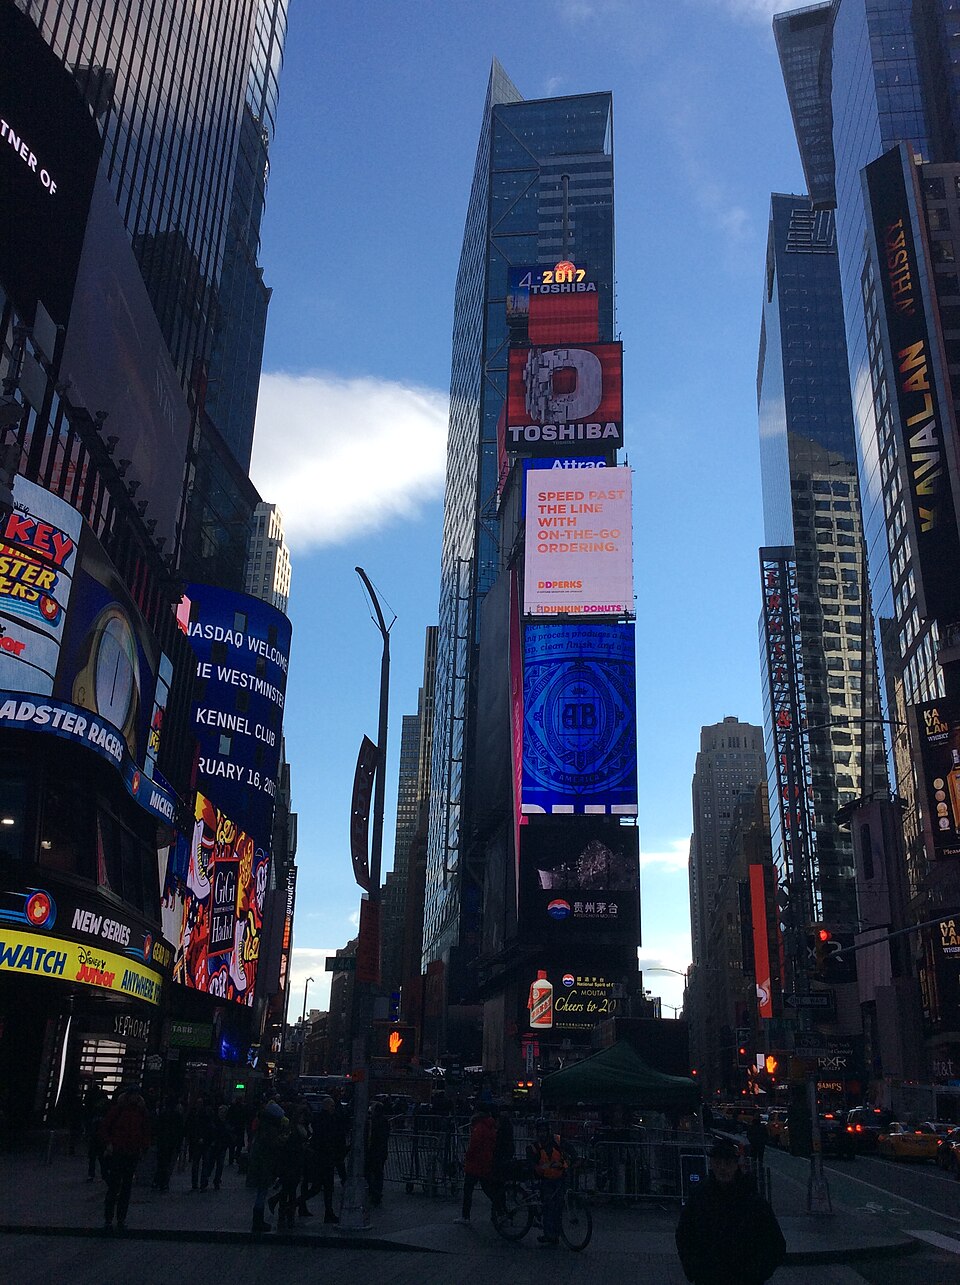
The transformation of Times Square from a neon-lit district to a high-definition digital canyon occurred rapidly between 2010 and 2025. This period marked the final displacement of static vinyl billboards by light-emitting diodes. Advertisers previously relied on physical signs that required days to install. The shift to digital surfaces allowed brands to change creative assets in milliseconds. This technological evolution fundamentally altered the economic structure of the Bowtie. Real estate owners stopped viewing facades as mere exterior walls. They began to treat building skins as primary revenue generators that frequently outperformed the office leases inside the structures.
The turning point for modern screen density arrived in November 2014. Vornado Realty Trust unveiled a massive display on the Marriott Marquis hotel at 1535 Broadway. This screen spanned the entire block front between 45th and 46th Streets. It measured roughly 25, 000 square feet and contained 24 million pixels. Mitsubishi Electric manufactured the hardware. The resolution exceeded 4K standards of the time. This installation rendered surrounding displays obsolete overnight. Google rented the screen immediately for a debut campaign. Industry reports estimated the cost at $2. 5 million for four weeks. This single event triggered an arms race among landlords. Property owners rushed to upgrade existing signage to match the brightness and pixel density of the Marriott display.
One Times Square remains the most valuable advertising asset in the world. The building itself is largely empty of office tenants. Its value lies almost entirely in its external shell. Jamestown Properties acquired the tower and focused on its signage rights. By 2024 the building generated over $23 million annually in advertising revenue. estimates place the valuation of the tower at $1 billion based solely on this income stream. The 2024 and 2025 redevelopment project integrated a new viewing deck and updated the LED facade. The northern face of the tower commands the highest rates in the district. Brands pay premiums to appear directly behind the New Year's Eve ball drop. This specific placement guarantees hundreds of millions of impressions during the annual December 31 broadcast.
The density of LED nodes increased drastically during this fifteen-year window. Screens in 2010 used a pixel pitch of 10 millimeters or greater. This resulted in grainy images when viewed from the street. By 2025 the standard pixel pitch for prime displays dropped to 6 millimeters or 8 millimeters. This tightening of diode spacing allowed for photorealistic imagery. The Coca-Cola sign at 2 Times Square serves as a prime example of mechanical innovation. Installed in 2017 the display features 1, 760 independently moving LED cubes. These motorized modules extend and retract to create physical depth. This engineering feat bridged the gap between digital video and kinetic sculpture. It demonstrated that screens could offer texture rather than just light.
TSX Broadway entered the market in 2023 and disrupted the established order. The development at 1568 Broadway incorporated an 18, 000 square foot wraparound screen. The developers built a permanent stage 30 feet above the street. This stage opens through the billboard itself. Artists can perform live to the crowd while the screen broadcasts the event. This integration of live performance and digital signage created a new category of experiential advertising. The TSX screen allows users to upload content via a mobile app for short durations. This democratization of the billboard space shifted the model from exclusive monthly buyouts to high-volume micro-transactions. It allowed individuals to buy 15 seconds of fame on the biggest screen in the Western Hemisphere.
Programmatic advertising technology reshaped the revenue flow by 2020. Media buyers previously negotiated contracts weeks in advance. The adoption of automated bidding platforms allowed advertisers to purchase slots in real time. A brand could trigger an ad only when specific conditions were met. For example a coffee chain could program their creative to appear only when the local temperature dropped 45 degrees. This efficiency increased the yield per minute for screen owners. Digital slots are sold in rotations. A single board might display eight different advertisers in a standard loop. This multiplication of inventory drove total district revenue well above $100 million annually.
Anamorphic illusions became the dominant creative trend starting in 2021. These three-dimensional visuals use forced perspective to make objects appear as if they are floating outside the screen. The technique requires a curved display or a corner unit to work. Pedestrians perceive a giant cat or a cascading wave crashing out of the building. These campaigns generate secondary value through social media. Tourists film the illusion and share it on mobile platforms. The organic reach of a successful anamorphic campaign frequently exceeds the direct impressions from foot traffic. Advertisers budget specifically for the production costs of these complex 3D assets. The creation of such content can cost upwards of $100, 000 in design fees alone.
The energy consumption of the district has drawn scrutiny. A single large-format LED display can consume as much electricity as 50 average American homes. The sheer heat generated by millions of diodes requires massive cooling systems. Building owners have adopted energy- LEDs to mitigate costs. The brightness of these screens is intense. New York City zoning regulations limit the light output in other neighborhoods. Times Square operates under special district rules that mandate bright signage. The zoning actually requires new developments to include illuminated signs. A building without a billboard in the Bowtie is technically non-compliant with the area's intended character. This regulatory framework ensures that the saturation of light only increase.
The cost to advertise varies wildly based on timing and location. A standard digital billboard might command $5, 000 to $25, 000 per day. Prime units like the Nasdaq Tower or the ABC SuperSign demand significantly higher rates. The Nasdaq screen stands seven stories tall and features a curved design. It is capable of full-motion video and live simulcasts. Financial firms frequently use it to announce IPOs. The visibility of this specific unit during market opening ceremonies adds a prestige factor that justifies the premium price. By 2025 the total inventory of digital signage in the Times Square Alliance district exceeded 200 distinct electronic faces.
| Metric | 2010 Standard | 2025 Standard |
|---|---|---|
| Display Technology | Incandescent / Low-Res LED | 4K/8K UHD LED / MicroLED |
| Pixel Pitch | 16mm, 25mm | 6mm, 10mm |
| Buying Model | Monthly / Annual Contracts | Programmatic / Real-Time Bidding |
| Creative Format | Static Image / Simple Loop | Anamorphic 3D / Interactive / Live Data |
| Prime Screen Size | 5, 000, 10, 000 sq ft | 15, 000, 25, 000 sq ft |
| Est. Daily Impressions | 300, 000 | 450, 000+ |
The financial dominance of these screens influences the architecture of the buildings they adorn. Architects design towers with blank windowless faces specifically to accommodate LED mesh. The interior layout of the building is secondary to the exterior advertising surface. the rent from the retail store at the base of the building is a fraction of the revenue generated by the sign above it. This economic reality has cemented Times Square as a unique zone where the virtual of information is more valuable than the physical of masonry. The district functions as a media machine and a real estate sector second.
New Year's Eve Crowd Control and Security Costs
The transformation of New Year's Eve in Times Square from a chaotic street party to a militarized containment zone mirrors the broader evolution of American policing. When Adolph Ochs inaugurated the tradition on December 31, 1904, to celebrate the New York Times' new headquarters, the event was a raw display of urban density. Approximately 200, 000 revelers packed the unpaved triangle, devoid of metal detectors or sniper teams. The signal for midnight was not a ball drop, a dynamite explosion fired from the roof of the Times Tower, a practice that would be unthinkable in the modern security climate. By contrast, the operation leading into 2026 resembles a forward operating base, costing taxpayers millions annually in overtime and infrastructure.
Crowd estimates for the event have long been a subject of statistical manipulation. City officials and event organizers frequently cite attendance figures between one and two million. Crowd science refutes this. G. Keith Still, a professor of crowd science, calculated that the available viewing area, the "bow tie" formed by the intersection of Broadway and Seventh Avenue, can safely hold approximately 120, 000 people at maximum density (5 to 7 people per square meter). To reach the claimed one million figure, the crowd would need to extend north to Central Park with dangerous compression levels. The inflated numbers serve a commercial purpose, driving advertising rates for the digital billboards that serve as the event's backdrop, they complicate security planning by obscuring the tactical reality.
The modern security architecture, frequently termed the "Ring of Steel," solidified following the September 11 attacks. The NYPD deploys a multi- containment strategy. The core of this system is the "pen" method, introduced in the 1990s. Police funnel attendees into barricaded enclosures starting in the afternoon. Once inside, civilians cannot leave without losing their spot; there are no public restrooms, a logistical reality that forces attendees to wear adult diapers or dehydrate themselves. This compartmentalization allows police to isolate disturbances and control surges, preventing the deadly crushes seen at other global mass gatherings.
even with these rigid controls, the perimeter remains. On New Year's Eve 2022, Trevor Bickford, a 19-year-old motivated by extremist ideology, attacked three officers with a kukri machete at a screening checkpoint on Eighth Avenue. The incident, which occurred outside the frozen zone, exposed the difficulty of securing the outer concentric circles of the event. Bickford was sentenced to 27 years in prison in May 2024, the attack forced a re-evaluation of the "outer ring" defense strategy, leading to expanded drone surveillance and the deployment of robotic units like the "Digidog" in subsequent years.
The financial cost of securing the event is substantial and frequently unclear. The NYPD's overtime budget has ballooned, with the department spending approximately $740 million on uniformed overtime in Fiscal Year 2023 alone. While a specific line item for New Year's Eve is rarely in public budget documents, analysis suggests the single night costs the city between $5 million and $7. 5 million in police overtime. This figure does not include the costs incurred by the Department of Sanitation (DSNY) or federal agency support.
Funding for this security apparatus became a flashpoint in late 2025. In October 2025, the federal administration threatened to cut $187 million in counterterrorism grants allocated to New York, a move that would have slashed the NYPD's intelligence and bomb squad budgets. After a bipartisan outcry involving Governor Kathy Hochul and NYPD leadership, the funding was reinstated days later. The dispute highlighted the city's dependence on federal revenue to maintain the high-tech surveillance grid, including radiation detectors and facial recognition cameras, that blankets Times Square during the ball drop.
| Year | Official Crowd Estimate | Scientific Capacity Limit | Security / Event Milestone |
|---|---|---|---|
| 1904 | 200, 000 | N/A (Open Street) | Dynamite explosion signal; no ball drop. |
| 1945 | 750, 000+ | Unknown | V-J Day celebration; peak historical density. |
| 2001 | 500, 000 | ~100, 000 | post-9/11 event; snipers, magnetometers, sand trucks. |
| 2020 | 0 (Public) | 0 | Closed to public due to COVID-19 ("Ghost NYE"). |
| 2022 | 1, 000, 000 (Claimed) | ~80, 000 | Machete attack on perimeter officers; "Pens" fully active. |
The aftermath of the celebration presents its own logistical challenge. The Department of Sanitation deploys an army of mechanical brooms and workers immediately after the ball drops., crews have removed between 50 and 65 tons of refuse in a single night. This includes approximately 3, 000 pounds (1. 5 tons) of confetti, much of it containing handwritten "wishes" from visitors submitted to the Times Square Alliance. The cleanup operation is a precision drill, requiring the square to be cleared and reopened to traffic by roughly 6: 00 AM on New Year's Day, restoring the commercial artery of Midtown Manhattan with industrial efficiency.
Commercial Real Estate Vacancy Rates 2020, 2026
The trajectory of Times Square's commercial viability reflects a violent oscillation between agrarian utility and speculative excess. In the mid-18th century, the land commanding of the highest price-per-square-foot valuations on Earth was the pastoral estate of John Morin Scott. His manor, situated near present-day 43rd Street, held zero commercial vacancy because it served a singular, self-sustaining purpose: agrarian survival and militia staging. By contrast, the period from 2020 to 2026 exposed the fragility of the district's hyper-specialized economy. When the COVID-19 pandemic struck in March 2020, the vacancy rate for physical occupancy surged to near 100% overnight, a collapse in utility not seen since the British occupation of Manhattan in 1776. This forced a recalibration of value that into early 2026, creating a bifurcated market where trophy assets command record rents while older stock faces obsolescence.
The immediate aftermath of the 2020 shutdown created a statistical anomaly in real estate records. While contractual vacancy, leases actually broken or expired, rose gradually, "availability rates" (space marketed for lease) spiked. By 2021, retail asking rents in the Times Square "Bowtie" had plummeted. Landlords who once demanded $2, 500 per square foot for ground-floor retail found themselves negotiating at $1, 600 or offering percentage-of-sales models to keep storefronts active. The departure of major tenants was not a pause a structural shift. The "flight to quality" became the dominant trend by 2023. Corporations abandoned Class B buildings on Seventh Avenue for new, state-of-the-art developments like One Vanderbilt (adjacent to the district) or heavily retrofitted spaces, leaving older towers with vacancy rates exceeding 20%.
A defining case study of this era is TSX Broadway at 1568 Broadway. Developed as a $2. 5 billion of entertainment, retail, and hospitality, it represented the wager on Times Square's recovery. The project involved lifting the historic Palace Theatre 30 feet in the air to create ground-floor retail space. Yet, financial engineering proved more precarious than structural engineering. In August 2024, the project's developers, L&L Holding Company and Investment Group, defaulted on a $1. 13 billion loan. Goldman Sachs took control of the property, a clear indicator that even premium, purpose-built assets were not immune to the high-interest-rate environment and sluggish return of office workers. The building is physically complete as of 2026, with the Tempo by Hilton hotel operating, the capital stack behind it collapsed.
The desperation to fill the commercial void led to the high- bid by SL Green Realty Corp. to convert 1515 Broadway into a Caesars Palace casino. This proposal, launched in earnest in 2023, promised to be a stabilizing economic engine, projecting thousands of jobs and a new anchor for the district. SL Green partnered with Caesars Entertainment and Roc Nation, lobbying aggressively that a gaming license was the only way to revitalize the aging office stock. The gamble failed. In September 2025, the Community Advisory Committee voted 4-2 against the proposal, killing the project. The rejection forced SL Green and other landlords to pivot back to traditional leasing strategies in a market that had fundamentally changed, leaving 1515 Broadway without the gaming revenue stream investors had hoped for.
As of February 2026, the market shows signs of a painful necessary correction. Retail availability in the Times Square corridor has tightened, dropping to approximately 13. 7% in late 2025, a historic low following the pandemic peak. This recovery, yet, comes at the cost of valuation. Average retail asking rents settled around $1, 506 per square foot in Q4 2025, a roughly 20% year-over-year decline and a far cry from the pre-2019 peaks. The completion of the One Times Square redevelopment in January 2026, led by Jamestown, injected new inventory into the market. The building, largely empty of office tenants for decades to maximize billboard revenue, features a public observation deck and museum, attempting to monetize the interior space that had long been sacrificed for exterior advertising.
| Year | Retail Asking Rent (Avg PSF) | Midtown Office Vacancy (Class A) | Key Market Event |
|---|---|---|---|
| 2019 | $1, 800+ | ~10. 5% | Peak valuations; historic low vacancy. |
| 2020 | $1, 650 (falling) | 12. 8% | Pandemic shutdown; "availability" spikes. |
| 2021 | $1, 400 | 16. 5% | Record sublease inventory floods market. |
| 2023 | $1, 250 | 18. 2% | Flight to quality; Class B vacancy widens. |
| 2024 | $1, 350 | 17. 5% | TSX Broadway loan default/foreclosure. |
| 2025 | $1, 506 | 14. 9% | Casino bid rejected; Retail tightens. |
| 2026 (Q1) | $1, 500 (est) | 13. 6% | One Times Square reopens interior. |
Office leasing in 2025 and early 2026 demonstrated that demand exists, only for specific assets. The KnitWell Group's renewal and expansion of 246, 000 square feet at 7 Times Square stands as a rare victory for the district's office sector. It highlights that tenants are to commit to the area if the building offers modern amenities and favorable terms. yet, the between Class A and Class B properties remains the central problem. While Midtown Class A vacancy dropped to roughly 13. 6% by the start of 2026, older buildings without significant capital improvements continue to value, facing conversion or obsolescence. The "doom loop" scenario of a total collapse did not materialize, the district has settled into a new reality where land value is no longer guaranteed by mere location, by the ability to adapt to a hybrid workforce and an experiential retail economy.
NYPD Surveillance Grid and Facial Recognition Deployment

In the early 20th century, surveillance in Times Square relied on human intelligence and physical intimidation. The NYPD's "Italian Squad," formed in 1904, and later the "Red Squad" (Bureau of Special Services and Investigations, or BOSSI), operated with impunity in the district's theaters and meeting halls. Detectives monitored anarchists, labor organizers, and later, anti-war protesters, compiling dossiers on index cards. During the 1970s and 1980s, as the area descended into what Rolling Stone called the "sleaziest block in America," the surveillance tactic shifted to vice enforcement. Plainclothes officers, including the specialized "runaway squads," patrolled the Deuce (42nd Street), physically intercepting teenagers disembarking at the Port Authority before pimps could claim them. This era relied on the "eyeball" method, officers memorizing faces and manually logging movements, a labor-intensive model that left vast gaps in coverage.
The terror attacks of September 11, 2001, provided the political capital to industrialize this observation. The Lower Manhattan Security Initiative (LMSI), initially designed to ring the Financial District with sensors, expanded north to Midtown in 2009 under the Midtown Manhattan Security Initiative (MMSI). This expansion brought the "Ring of Steel" concept to Times Square. By 2010, the NYPD had integrated private corporate camera feeds with city-owned sensors, feeding data into the Domain Awareness System (DAS). Developed in partnership with Microsoft, DAS centralized thousands of video streams, 911 calls, and arrest records into a single dashboard. The failed 2010 car bombing attempt by Faisal Shahzad accelerated this integration, justifying the installation of hundreds of additional "Argus" cameras, white boxes marked with NYPD logos that became ubiquitous on lamp posts from 42nd to 47th Streets.
By 2020, the density of sensors in Times Square had surpassed that of major airports. The grid included Automated License Plate Readers (ALPRs) at every major intersection, tracking vehicle movements in real-time. SoundThinking's ShotSpotter system, a network of acoustic sensors, was deployed to triangulate gunfire within seconds, though critics frequently noted its chance to record conversations and its high rate of false positives from construction noise or fireworks. Data from these sensors did not; it was retained, searchable, and correlated. A 2022 investigation by Amnesty International revealed that a person walking through Times Square could be captured by facial recognition-compatible cameras for 100% of their route. The organization's "Ban the Scan" campaign highlighted how this infrastructure disproportionately targeted protesters and minority communities, turning the tourist hub into a biometric dragnet.
The deployment of facial recognition technology remains the most contentious aspect of this grid. While the NYPD publicly stated it did not use facial recognition on live video feeds, it confirmed the use of the technology on still images "probed" against arrest databases. This distinction offered little comfort to privacy advocates, particularly after the wrongful arrest of Robert Williams in Detroit and similar cases in New York exposed the technology's racial bias. In one 2025 incident, a Brooklyn man named Trevis Williams was arrested for a crime in Manhattan after an algorithm incorrectly matched his face to grainy CCTV footage, even with an eight-inch height difference between him and the suspect. These failures did not halt the program; instead, the database of reference images expanded.
The years 2023 to 2026 marked the introduction of autonomous surveillance agents. In 2023, the NYPD deployed the K5 security robot, a 400-pound autonomous machine manufactured by Knightscope, into the Times Square subway station. Leased for $9 an hour, the robot was equipped with four cameras absence the ability to navigate stairs or intervene in crimes. It was retired in early 2024 after failing to provide operational value, ending its tenure in a vacant storefront. Yet, the department pivoted to more agile robotics. The "Digidog," a quadruped robot by Boston, was reintroduced in 2023 for high-risk situations, drawing immediate comparisons to dystopian fiction. By New Year's Eve 2025, the surveillance strategy had taken to the skies. The NYPD's drone fleet, which saw a 3, 200% increase in flights between 2022 and 2025, became a standard fixture above the ball drop. For the arrival of 2026, a swarm of tethered and free-flying drones provided a continuous aerial feed, monitoring the crowd of one million for "anomalies" and feeding data directly to the Joint Operations Center.
The physical infrastructure of Times Square serves a dual purpose: advertising and monitoring. The digital billboards that define the square's aesthetic distract from the smaller, darker lenses watching the spectators. By early 2026, the Department of Transportation began activating red-light cameras at 600 new intersections citywide, further tightening the net. The "Crossroads of the World" is no longer just a meeting place; it is a high-resolution archive of human behavior, where anonymity is technically impossible and every movement is a data point in a server farm.
| Era | Primary Method | Key Technology/Unit | Scope of Coverage |
|---|---|---|---|
| 1904, 1950s | Human Intelligence | Italian Squad, BOSSI (Red Squad) | Targeted infiltration of political groups and labor unions. |
| 1970s, 1990s | Physical Patrols | Plainclothes Vice Squads, Runaway Squads | Manual spotting of sex work and truancy; visual memory. |
| 2001, 2010 | Networked CCTV | LMSI/MMSI, Ring of Steel | Fixed cameras at key entry points; post-incident review. |
| 2011, 2020 | Algorithmic Integration | Domain Awareness System (DAS), ShotSpotter | Real-time data fusion; license plate tracking; acoustic detection. |
| 2021, 2026 | Biometric & Autonomous | Facial Recognition, Drones, Digidog | Aerial surveillance; automated identity matching; robotic patrols. |
Costumed Character Licensing and Solicitation Laws 2015, 2026
By 2015, the pedestrian plazas of Times Square had devolved into a chaotic marketplace of coerced gratuities, resembling the unregulated carriage stands of the late 19th century rather than a modern civic space. The Times Square Alliance reported that the number of costumed characters, ranging from counterfeit Disney figures to topless "desnudas" painted in body latex, had swelled to over 300 daily operators. Public order complaints surged, with 42% of surveyed visitors reporting unpleasant interactions involving aggressive solicitation. The tipping point arrived in late 2015 following a series of high-profile incidents, including the arrest of a Spider-Man for assaulting a police officer and an "Elmo" conviction for groping a teenager. These events forced the de Blasio administration to abandon its previous hands-off method to street performance, initiating the most significant rezoning of public conduct in the area since the removal of the pornographic theaters in the 1990s.
The legislative response was swift and spatial. In April 2016, the City Council passed Intro 1109-A, granting the Department of Transportation (DOT) authority to regulate pedestrian plazas as distinct legal entities separate from standard sidewalks. This law manifested physically in June 2016 with the installation of " Activity Zones" (DAZs). City workers painted eight rectangular boxes, each measuring 8 by 50 feet, in a specific shade of "Techno Teal" on the pavement. Under the new rules, any commercial activity, defined legally to include posing for photos in exchange for tips, was restricted strictly to these teal boxes. The remaining pavement was demarcated with white tape as "Flow Zones" for transit and "Chill Zones" for stationary leisure, criminalizing the act of soliciting a tip outside the painted lines.
Enforcement data from 2016 to 2017 reveals the immediate mechanical impact of this zoning. Arrests of costumed characters plummeted from 36 in the year prior to the zones to just eight in the year following. Yet, the volume of civil summonses spiked, with NYPD officers issuing over 220 tickets for zone violations in the twelve months. The strategy shifted from criminal prosecution of aggressive behavior to administrative management of spatial violations. This created a "whac-a-mole" where characters would simply migrate to areas just outside the plaza boundaries, such as 42nd Street or Rockefeller Center, where the teal zones did not exist. The economic pressure on these workers, of whom are immigrants operating in a gray market economy, meant that the risk of a civil summons was frequently calculated as a cost of doing business.
The regulatory framework expanded further with Local Law 99 of 2021, which codified the "Theatre District Zone" into the city's administrative code. This legislation extended the DOT's zoning authority beyond the plazas to cover the sidewalks of the surrounding grid, encompassing 40 Broadway theaters and high-density transit corridors. The 2021 expansion acknowledged that the 2016 containment strategy had displaced the solicitation problem rather than solving it. By 2023, the Times Square Alliance reported that while the plazas remained relatively orderly, the congestion of solicitors had thickened on the periphery, creating bottlenecks on 7th and 8th Avenues that mirrored the pedestrian gridlock of the early 1900s.
| Metric | 2015 (Pre-Zone) | 2017 (Post-Zone) | 2024 (Current Era) |
|---|---|---|---|
| Daily Active Characters (Est.) | 300+ | 180-220 | 250+ |
| Annual Arrests (Solicitation) | 36 | 8 | < 5 |
| Civil Summonses Issued | N/A | 220+ | 450+ |
| Visitor Negative Experience Rate | 42% | 26% | 31% |
The post-pandemic era introduced new complexities with the passage of Local Law 122 of 2025, which took effect in March 2026. This law decriminalized street vending by replacing criminal misdemeanors with civil citations, a move intended to protect undocumented vendors from the justice system. While well-intentioned, the legislation blurred the lines for police officers attempting to regulate costumed characters. Since the characters they are performers exercising Amendment rights rather than vendors selling goods, the removal of criminal penalties for vending emboldened operators to ignore the teal zone boundaries more brazenly. By early 2026, the strict geometric order established in 2016 had begun to, with characters once again weaving through the "Flow Zones," betting that an understaffed NYPD would prioritize violent crime over civil solicitation tickets.
This 21st-century struggle over pavement rights echoes the district's earliest history. In the 1700s, the area was a convergence of streams and rural commons where boundaries were defined by topography rather than paint. By the 1890s, the "carriage trade" dominated Longacre Square, with hansom cab drivers fighting fiercely for curb space to solicit passengers, a direct historical parallel to the Elmos and Batmans of 2026 fighting for foot traffic. In both eras, the core conflict remains the monetization of public attention in one of the world's most dense intersections. The "Techno Teal" boxes are the latest attempt to impose a grid of control upon a space that, by its very nature, thrives on kinetic disorder.
Caesars Palace Bid and SL Green Realty Proposals 2023, 2026
| Metric | SL Green / Caesars Proposal | Opposition (No Times Square Casino) |
|---|---|---|
| Economic Projection | $7 billion in tax revenue over 10 years; 3, 800 permanent union jobs. | Projected losses in theater ticket sales due to congestion; "cannibalization" of local dining. |
| Community Investment | $250 million fund for safety, sanitation, and childcare for Broadway workers. | Argued funds were a "bribe" to offset quality-of-life deterioration. |
| Traffic Impact | Proposed 25% reduction in congestion through new traffic enforcement funding. | Predicted gridlock on 44th and 45th Streets, blocking emergency vehicles and theater deliveries. |
| Public Sentiment | support from construction unions (Laborers Local 79) and retail groups. | Tulchin Research poll (Sept 2025) showed 71% of Midtown residents opposed the project. |
The conflict reached its administrative climax on September 17, 2025. The Community Advisory Committee (CAC), a six-member panel appointed by state and city officials to vet the proposal, convened to cast a binding vote. Under New York's casino siting rules, a bid required a two-thirds majority from the CAC to advance to the State Gaming Commission. In a stunning rebuke to the developers, the committee voted 4-2 against the project. Committee members who voted "no" the overwhelming opposition from local residents and the incompatibility of a casino with the family-friendly brand Times Square had cultivated since the 1990s. The vote killed the bid for the 2025 pattern. SL Green CEO Marc Holliday reacted with visible fury, labeling the decision a "despicable display of cowardice" and accusing the committee of ignoring the economic benefits for the city's working class. The aftermath of the vote revealed the high of the licensing process. In the weeks following the rejection, SL Green and its partners launched a legal and public relations counter-offensive. They argued that the CAC process was flawed and hinted at chance litigation to overturn the result. By October 2025, the shifted again when MGM Resorts unexpectedly withdrew its bid for a full casino license at Empire City in Yonkers, citing unfavorable economic conditions. This withdrawal left a vacuum in the competition, which SL Green attempted to exploit by lobbying Albany lawmakers to reconsider the Times Square rejection. As of February 2026, the status of the Caesars Palace bid remains a zombie proposition, technically defeated refusing to die. The developers continue to hold the lease on 1515 Broadway, and the "No Times Square Casino" coalition remains on high alert, maintaining their war chest for a chance second round of battles. The delay in awarding the downstate licenses, pushed to late 2026, has given the consortium a narrow window to restructure their proposal or seek a legislative override, though such a move would require expending massive political capital. The casino war exposed the deep fractures in the post-pandemic identity of Times Square. For the developers, the district is an under-monetized asset in need of a high-yield anchor tenant to replace the fading dominance of traditional office space. For the theater community and residents, it is a cultural precinct whose value cannot be measured solely in tax receipts. The fight over 1515 Broadway was never just about roulette wheels and slot machines; it was a referendum on the soul of the crossroads. The physical reality of 1515 Broadway today reflects this suspended animation. The office tower stands fully leased, the Lion King continues its decades-long run, and the street level remains a chaotic mix of tourists and buskers. Yet, the specter of the casino looms. The $5. 4 billion proposal proved that even in a district defined by constant change, there are lines the community is unwilling to cross. The rejection of the casino bid stands as a rare instance where the shared of a neighborhood, backed by the cultural weight of Broadway, managed to halt the advance of a multi-billion dollar corporate juggernaut. Whether this victory is permanent remains the open question of 2026. With the state facing budget shortfalls and the allure of gambling revenue remaining potent, the file on Caesars Palace Times Square sits in a drawer in Albany, closed not sealed. The neon lights of Times Square shine on, the power beneath the pavement have shifted, proving that even the "Crossroads of the World" is not just a marketplace, a neighborhood capable of defending its own definition of progress.