Verified Against Public And Audited RecordsLast Updated On: 2026-02-24
Reading time: ~51 min
File ID: EHGN-PLACE-32230
Investigative Bio of Tokyo
Edo Era Fire Suppression and Sanitation Zoning (1700, 1868)
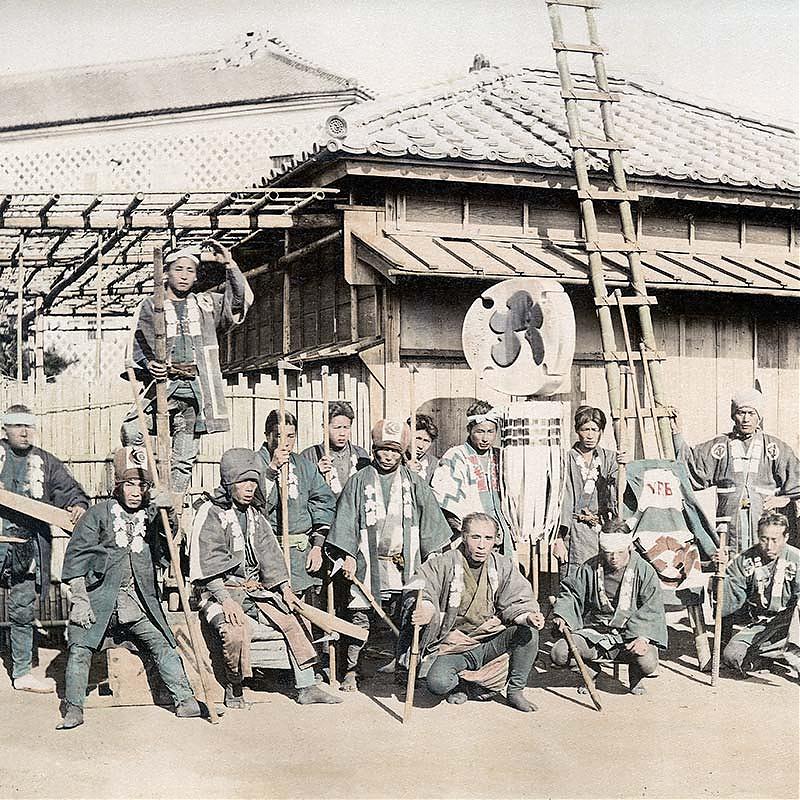
Edo, the progenitor of modern Tokyo, functioned as a high-density combustible engine where urban planning was dictated by the physics of fire and the economics of waste. By 1721, the shogunate census recorded a population exceeding one million, a density that outstripped London and Paris. This demographic pressure created a dual-system city: the Yamanote uplands for the samurai class and the Shitamachi lowlands for commoners. The latter consisted of wood-and-paper machiya packed so tightly that a single overturned lantern could incinerate entire districts. Between 1601 and 1867, records document 1, 798 fires. Forty-nine of these were classified as "great fires" that razed substantial portions of the urban grid. The administration did not view these conflagrations as disasters. They were cyclical metabolic events that forced periodic renewal of the city's architecture and street layout.
The shogunate's response to this incendiary threat shifted decisively in 1720 with the Kyoho Reforms under Shogun Tokugawa Yoshimune. Recognizing that samurai-led fire units (*jōbikeshi*) were insufficient for the sprawling commoner districts, the administration established the *machibikeshi*, or town fire brigades. These units were not water-pumping squads demolition crews. Their primary tactic involved the rapid destruction of buildings surrounding a blaze to starve the fire of fuel. By 1738, the city maintained 48 distinct brigades organized by the *iroha* syllabary, comprising over 11, 000 firefighters. This ratio of approximately one firefighter per 50 to 90 citizens represented a mobilization of civil defense unseen in contemporary Western capitals. The legacy of these volunteer corps in 2026 through the *shobodan* community fire teams that still patrol Tokyo's neighborhoods during dry winter months.
Urban zoning adapted physically to the fire threat through the creation of *hirokoji* (wide alleys) and *hiyokechi* (firebreaks). After the catastrophic Meireki Fire of 1657, which killed over 100, 000 people, officials mandated these open spaces at serious bridgeheads and intersections, such as Ueno and Ryogoku. These zones functioned as tactical voids where flames could not leap across. In the 21st century, these former firebreaks constitute the footprint for of Tokyo's major avenues and parks. The wide thoroughfares of modern Chuo Ward trace the lines drawn by Edo planners who prioritized survival over real estate maximization. The 1772 Great Meiwa Fire, which killed an estimated 14, 700 people and destroyed 178 temples, reinforced the need of these zones. It also accelerated the mandate for tile roofing over flammable thatch, a regulation that slowly transformed the visual texture of the city from organic brown to slate grey.
Sanitation in Edo operated on a radically different economic model than the sewer-based systems of Europe. While London and Paris struggled with cholera and overflowing cesspits, Edo maintained a sophisticated circular economy based on night soil (*shimogoe*). Human waste was not treated as refuse as a high-value commodity essential for agricultural fertilizer. Farmers from the surrounding Kanto Plain traveled into the city to purchase waste, paying residents in cash or vegetables. This market-driven removal system kept the Sumida and Kanda rivers remarkably clean compared to the Thames or Seine. Historical data indicates that the waste of high-ranking samurai commanded higher prices than that of commoners, based on the nutrient density derived from a superior diet.
Table 1: Edo Period Urban Metabolism & Safety Metrics (c. 1720, 1860)
Metric
Data Point
Context/Impact
Population Density
~60, 000/km² (Shitamachi)
Far exceeded modern Tokyo average (~6, 400/km²). Created extreme fire propagation rates.
Firefighting Force
11, 429 personnel (1738)
Organized into 48 *iroha* brigades. Primary tactic: tactical demolition.
Night Soil Value
2 bu to 1 ryo per boat
Waste from 10 households could trade for ~1, 500 radishes. Prevented river pollution.
Major Fire Frequency
Every 25, 50 years
Driven by dry winter winds (*Karakaze*). The "Great Fires" defined urban renewal pattern.
Water Infrastructure
150km+ wooden piping
Kanda and Tamagawa aqueducts supplied potable water, bypassing groundwater contamination.
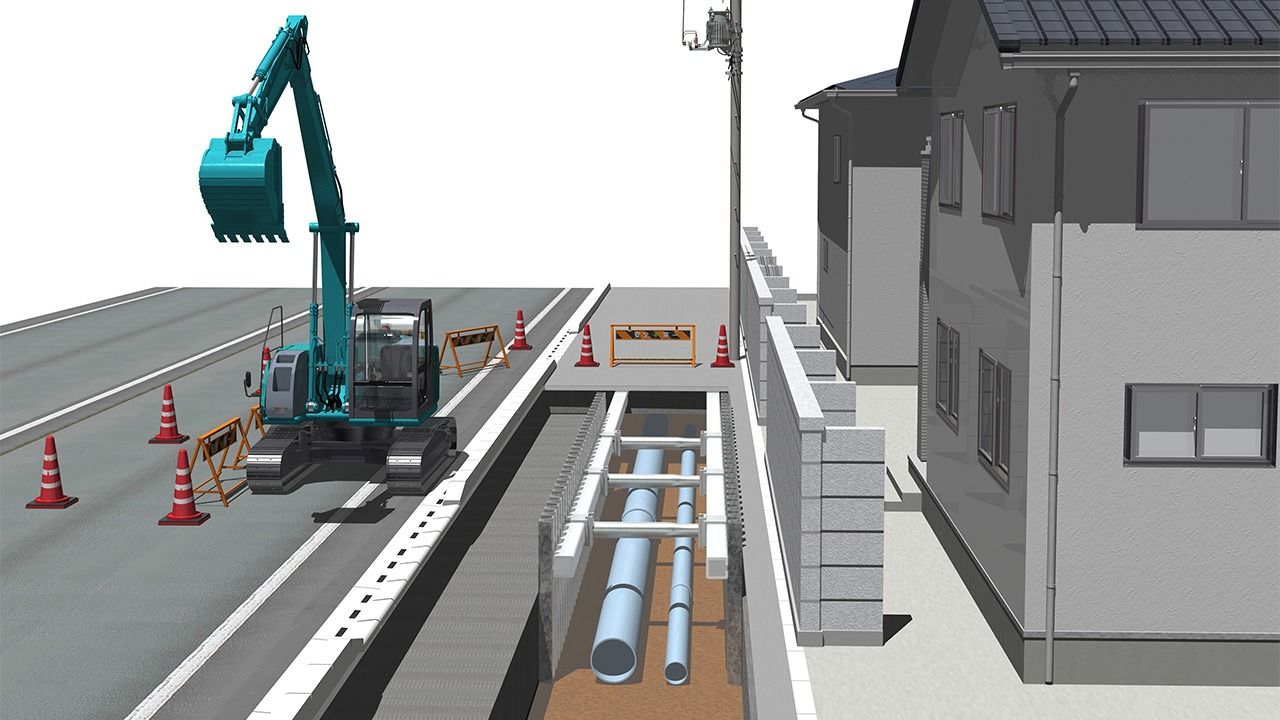
The economic value of night soil created a rigorous collection network that prevented the accumulation of filth. In 1742, rights to collect waste from specific daimyo estates were auctioned to the highest bidder. A recorded transaction shows the Hitotsubashi estate selling its waste rights for either two *ryo* in gold or the equivalent of 2, 000 middle-sized radishes. This financial incentive ensured that Edo did not require a municipal sewage department until the Meiji era. The absence of underground sewers, yet, meant that storm water drainage relied on surface gutters and canals. This reliance on surface water management influenced the city's topography, creating a network of waterways that were slowly filled in during the 19th and 20th centuries to create roads. The ghost rivers of 2026 Tokyo, frequently visible as winding green route or sunken streets, are the direct descendants of this Edo-era drainage logic.
Water supply infrastructure in Edo was equally advanced, driven by the need to bypass the saline groundwater of the bay area. The Kanda and Tamagawa aqueducts, completed in the mid-17th century, channeled fresh water from the western hills through a complex network of wooden pipes (*mokusei suido*). These pipes fed community wells (*ido*) that served as social hubs for the commoner districts. The engineering required to maintain hydraulic pressure over dozens of kilometers without electric pumps demonstrates a mastery of civil engineering that rivaled Roman achievements. This centralized water system allowed the population to densify further, the fire risk while solving the hydration needs of a megacity. The wooden piping system was so extensive that modern construction projects in the 2020s frequently unearth sections of these hollowed logs, still preserved in the anaerobic clay.
The transition from Edo to Tokyo in 1868 did not immediately these systems. The *machibikeshi* structure remained the backbone of fire protection well into the Meiji period, as the new government absence the funds to mechanize the force immediately. The night soil trade continued to support Kanto agriculture until the widespread adoption of chemical fertilizers in the 1950s. This persistence highlights a central theme in Tokyo's development: the of modern technology over pre-modern social contracts. The city of 2026 functions on a street grid carved by 18th-century firebreaks, protects itself with community structures rooted in 1720s reforms, and manages its water resources using rights and routes established by Tokugawa engineers. The "Flowers of Edo" may no longer bloom with the same destructive frequency, the garden they scorched remains the foundation of the modern capital.
Edo's zoning also enforced a rigid class separation that dictates real estate values today. The high ground (Yamanote) was reserved for daimyo estates, which eventually became the sites for embassies, universities, and luxury hotels. The low ground (Shitamachi) housed the artisans and merchants, evolving into the commercial and light industrial zones of Taito and Sumida wards. This topographical class divide is visible in 2026 land price maps, where the elevation of a plot frequently correlates with its price per square meter. The shogunate's allocation of land was not administrative; it was a geological destiny that modern zoning laws have largely preserved. The risk profile has shifted from fire to flood in the lowlands, yet the distinction between the "High City" and "Low City" remains a defining characteristic of the metropolis.
The Bunka Fire of 1806, which killed 1, 200 people, marked the beginning of the end for the purely wooden city. It prompted stricter regulations on plaster construction (*dozo-zukuri*) for merchant storehouses. These mud-walled structures were the only buildings to survive the great blazes, serving as fireproof safes for goods and valuables. By the mid-19th century, the streetscape of commercial Edo was punctuated by these black-and-white storehouses, a visual testament to the capital's adaptation to its own flammability. This architectural evolution set the stage for the brick and stone transformation of the Meiji era, proving that Edo's urban planning was never static a reactive system constantly calibrating against the threat of annihilation.
Meiji Industrialization and Waterworks Modernization
Edo Era Fire Suppression and Sanitation Zoning (1700, 1868)
The transition from Edo to Tokyo in 1868 was a rebranding of the software while the hardware remained dangerously obsolete. The imperial capital inherited a wooden urban grid that was biologically hazardous. Between 1877 and 1886, the administration faced a threat more lethal than insurrection. Cholera arrived in waves. The 1886 epidemic alone killed 108, 405 people nationwide. Tokyo functioned as the epicenter. The open-air Tamagawa Aqueduct, once the pride of the shogunate, had become a vector for Vibrio cholerae. The water supply system required a total industrial overhaul to prevent the city from consuming its own waste.
The Meiji government hired Scottish engineer William Kinnimond Burton to redesign the metabolic systems of the capital. Burton condemned the wooden pipe network that had served Edo for two centuries. His 1888 master plan mandated the installation of pressurized cast-iron mains and sand filtration systems. The culmination of this effort was the Yodobashi Purification Plant. Construction began in 1893 and operations commenced on December 1, 1898. The facility delivered 170, 000 cubic meters of potable water daily to Kanda and Nihonbashi. This engineering feat decoupled the city's hydration from its sewage. It marked the time Tokyo residents could drink from a tap without the immediate risk of "korori," the sudden death associated with cholera.
Fire suppression demanded an equally radical shift in material science. The Ginza fire of 1872 incinerated the district and prompted the government to abandon wood for brick. British architect Thomas Waters designed "Ginza Bricktown" as a fireproof buffer and a display of Western modernization. The project was a financial and structural failure. The Georgian-style brick damp-proof courses failed in the humid Japanese climate. Mold rotted the interiors. Residents refused to occupy the stone cells. The experiment cost the government a fortune yet established a zoning precedent. The city would henceforth be built of non-combustible materials by decree.
Private capital accelerated this hardening of the urban. In 1890, the Imperial Japanese Army sought to sell its parade grounds and barracks near the palace to fund modernization. The government offered the swampy, weed-choked plot to the business community. Iwasaki Yanosuke, the second president of Mitsubishi, purchased the entire Marunouchi tract for 1. 28 million yen. Critics ridiculed the purchase of "Mitsubishi-ga-hara" (Mitsubishi's wasteland). Iwasaki ignored them. He constructed the Mitsubishi Ichigokan in 1894 and developed a district of red-brick office blocks known as "Iccho London." This transaction transferred the center of for Tokyo's economy from the merchant quarters of Nihonbashi to the corporate of Marunouchi.
Key Infrastructure Milestones: Meiji Tokyo (1872, 1898)
Year
Event
Metric / Cost
1872
Ginza Fire & Bricktown Project
Complete destruction of wooden district
1886
Great Cholera Epidemic
108, 405 deaths (National)
1890
Mitsubishi Buys Marunouchi
1. 28 million Yen
1898
Yodobashi Plant Opens
170, 000 m³/day capacity
The industrialization of the Sumida River basin proceeded without the safeguards applied to the water supply. Factories producing soap, matches, and textiles lined the riverbanks of the Shitamachi lowlands. By 1900, the river had darkened with chemical runoff. The zoning distinction became absolute. The Yamanote uplands received the clean water and the brick offices. The lowlands received the effluent and the factory smoke. This laid the groundwork for the social stratification that would define 20th-century Tokyo politics.
The legacy of the Meiji infrastructure boom presents a serious liability in 2026. While the Bureau of Waterworks has achieved a leakage rate of just 2. 0 percent, a world-leading metric, the seismic resilience of the system remains uneven. Data from 2024 indicates that while 66. 8 percent of main pipelines in Tokyo meet modern earthquake resistance standards, the purification plants themselves lag dangerously behind. The seismic compliance rate for these facilities stood at a 13. 2 percent. The iron veins laid by Burton and his successors held the city together for a century., they represent a fragile point of failure in the event of a capital-centered earthquake.
Post-1923 Earthquake Reconstruction and Street Grid Realignment
The Great Kanto Earthquake of September 1, 1923, functioned as a violent urban reset. While the tectonic shift shattered the city's bones, the subsequent firestorm, which consumed 44 percent of Tokyo and killed over 105, 000 people, erased its skin. For Home Minister Goto Shinpei, the ash heap presented a singular administrative opportunity: the chance to rebuild Tokyo not as a flammable feudal relic, as a fireproof imperial capital modeled on Paris or London. Goto immediately commissioned a reconstruction plan with a budget of 4. 1 billion yen, a figure roughly four times the national budget of 1922. His vision demanded the complete purchase of burnt districts to impose a grand, westernized geometry upon the city.
Political reality crushed this ambition within months. The Imperial Diet, facing fiscal austerity and fierce opposition from landowners, slashed Goto's budget to a mere 575 million yen, later adjusted to 744 million. This 85 percent reduction forced the Reconstruction Board to abandon the idea of total state land acquisition. Instead, they deployed a legal method known as kukaku seiri (land readjustment). Under this system, the state did not buy land; it seized it. The government 3, 117 hectares of the burnt area, roughly 90 percent of the destruction zone, for mandatory reorganization. Landowners were legally compelled to surrender approximately 10 to 15 percent of their plots without compensation, a process called bu-biki. This confiscated acreage was pooled to create the widened arterial roads and public spaces that define central Tokyo today.
The physical legacy of this aggressive rezoning is most visible in the grid of "firebreak" avenues cut through the Shitamachi lowlands. Showa-dori, the reconstruction's flagship artery, was paved at a width of 44 meters. While this fell short of Goto's original 108-meter proposal, it was still four times wider than the standard Edo-era street, designed specifically to halt the creep of urban conflagrations. Alongside Meiji-dori and Yasukuni-dori, these boulevards introduced a hierarchy of transit and safety that the city had never possessed. The reconstruction also replaced roughly 400 wooden with fire-resistant steel and concrete structures, permanently altering the city's riverine logistics.
Beyond roads, the reconstruction introduced a widespread method to disaster survival through the integration of education and refuge. The Reconstruction Board built 52 "small parks" directly adjacent to 117 newly constructed reinforced concrete primary schools. This design created a dual-use infrastructure: in peacetime, the parks served as playgrounds; in disaster, the school provided fireproof shelter while the park offered an assembly point and firebreak. This modular unit of the "school-park" remains a serious node in Tokyo's 2026 disaster prevention map, serving as the evacuation site for millions of residents.
Housing underwent a parallel, though less widespread, evolution. The Dojunkai (Mutual Benefit Foundation) was established in 1924 to provide housing for the displaced. Between 1924 and 1934, the Dojunkai constructed 16 apartment complexes using reinforced concrete, a radical departure from the wood-and-paper nagaya tenements that had fueled the 1923 inferno. These developments, such as the Aoyama and Daikanyama apartments, introduced the concept of fireproof, vertical living to the Japanese middle class. Although most original Dojunkai buildings were demolished by the early 2000s to make way for commercial high-rises, they established the architectural precedent for the concrete "mansions" that dominate the modern skyline.
Comparison of 1923 Reconstruction vs. 2026 Resilience Planning
Metric
Goto Plan (1923)
Tokyo Resilience Project (2026)
Budget
4. 1 Billion Yen (Proposed) / ~744 Million Yen (Actual)
15 Trillion Yen (Allocated 2022-2040)
Primary Strategy
Land Readjustment (Kukaku Seiri) & Widening Arterials
Eliminating Wood-Dense Districts (Mokumitsu) & Water Retention
Key Infrastructure
Showa-dori (44m width), 52 School-Parks
Underground Regulating Reservoirs, Super Levees
Target Area
3, 117 Hectares (Burnt Zone)
City-wide (Focus on Arakawa/Sumida basins)
The failure to fully implement Goto's original 4 billion yen plan left a dangerous inheritance. Because the budget cuts prevented the complete eradication of the wooden urban fabric, dense belts of flammable timber housing outside the new arterial firebreaks. These areas, known today as mokumitsu (wooden dense districts), remain the primary target of the Tokyo Metropolitan Government's urban planning in 2026. The "Tokyo Resilience Project," launched in December 2022 with a 15 trillion yen budget, essentially attempts to finish the job Goto started. Current data from 2025 indicates that while the 1923 grid successfully compartmentalized the city center, the peripheral zones, which rapidly urbanized post-1923 without strict zoning, retain a fire risk that modern planners are frantically racing to neutralize before the inevitable seismic event.
The street grid realignment of the 1920s did not widen roads; it standardized the chaotic feudal lot sizes into the rectangular plots that dictate the footprint of modern Tokyo buildings. The kukaku seiri method pioneered in 1923 became the standard tool for Japanese urban development, used again after the 1945 firebombings and during the rapid growth of the 1960s. Every time a pedestrian crosses the expansive intersection of Yasukuni-dori and Chuo-dori, they are traversing a firebreak engineered by bureaucrats who viewed the city's destruction as the only way to save it.
Strategic Bombing Damage Assessments and 1950s Rapid Rebuilding
Meiji Industrialization and Waterworks Modernization
The physical annihilation of Tokyo in 1945 was not a byproduct of general combat the result of a calculated engineering problem solved by the United States Army Air Forces. Planners identified the city's traditional wooden architecture as a specific vulnerability, distinct from the brick and stone of German. The solution was the M69 incendiary bomblet, a six-pound steel pipe filled with jellied gasoline and equipped with a time-delay fuse. On the night of March 9, 1945, during Operation Meetinghouse, 279 B-29 Superfortresses released 1, 665 tons of these munitions over the Shitamachi lowlands. The clusters broke apart at 2, 000 feet, scattering tens of thousands of M69s that punched through tile roofs before igniting. The resulting firestorm generated surface temperatures exceeding 1, 800 degrees Fahrenheit and sucked oxygen from the air with such force that superheated winds tossed fleeing civilians into canals. By dawn on March 10, approximately 15. 8 square miles of the capital had been reduced to ash.
The statistical footprint of this single raid surpassed the immediate destructive yield of the atomic bombings that would follow months later. The Tokyo Metropolitan Police Department recorded 267, 171 buildings destroyed in that twelve-hour window. Casualty estimates remain a subject of historical debate, yet the consensus settles on approximately 100, 000 dead and over one million left homeless. The strategic bombing campaign continued until August, leveling 50 to 60 percent of the city's urban core. The demographic collapse was absolute; the population, which stood at 7. 35 million in 1940, plummeted to 3. 49 million by the time of surrender in 1945. Millions fled to the countryside, leaving behind a "burnt field" (yakeato) where the only vertical structures remaining were the concrete shells of schools, bank vaults, and the hardened smokestacks of bathhouses.
Post-war planners initially viewed this tabula rasa as an opportunity to correct the urban defects of the Edo and Meiji eras. In 1946, the War Damage Reconstruction Board proposed an ambitious master plan led by Ishikawa Hideaki. This vision included wide boulevards to serve as firebreaks, extensive green belts, and a decentralized zoning grid designed to cap the population at 3. 5 million. The plan required the government to purchase vast tracts of land to widen streets and install modern sewage systems. Yet the economic reality of 1949 crushed these aspirations. The implementation of the "Dodge Line," a strict austerity program directed by U. S. banker Joseph Dodge to curb hyperinflation, slashed the reconstruction budget. The grand boulevards were abandoned, and the green belts were sold off. Consequently, the city began to rebuild on its medieval footprint, with wooden shacks rising on the exact plots of their incinerated predecessors, cementing a chaotic sprawl that defines Tokyo's geography to this day.
The economic engine that eventually funded Tokyo's resurrection arrived from an external conflict. The outbreak of the Korean War in June 1950 transformed Japan into the primary supply depot for United Nations forces. This "special procurement" (tokuju) injected approximately $2. 3 billion into the Japanese economy between 1950 and 1953. Factories in the Keihin industrial belt, previously slated for as war reparations, were reactivated to produce trucks, uniforms, and steel for the front lines. This liquidity emergency resolution allowed the government to shift focus from subsistence to infrastructure. The "Jimmu Boom" of 1956, 1957 marked the point where Japan's economy surpassed its pre-war peak, driven by a private investment pattern that centered on Tokyo's reindustrialization.
Tokyo Recovery Metrics (1945, 1955)
Metric
1945 (Surrender)
1950 (Korean War Start)
1955 (Pre-Boom)
Population
3. 49 Million
6. 27 Million
8. 03 Million
Housing absence
4. 2 Million Units (National)
3. 1 Million Units
2. 7 Million Units
Industrial Output Index
10 (Base 1935=100)
83
180
Avg. Caloric Intake
1, 400 kcal
1, 900 kcal
2, 100 kcal
The return of evacuees created a housing emergency that the private sector could not handle. By 1955, the population had rebounded to 8 million, yet the housing stock lagged significantly. The government responded by establishing the Japan Housing Corporation (JHC) in 1955, an entity tasked with mass-producing fireproof accommodation. The JHC introduced the danchi, multi-story reinforced concrete apartment complexes that became the visual symbol of the new Tokyo. These structures replaced the flammable wood-and-paper vernacular with steel and cement, offering a standard "2DK" layout (two rooms plus a dining-kitchen area). For the time, the average Tokyo family had access to private indoor plumbing and gas, amenities that fueled the domestic consumption of the "Three Sacred Treasures": the refrigerator, the washing machine, and the black-and-white television.
This transition to concrete was not architectural psychological. The danchi represented a break from the multi-generational households of the past, facilitating the rise of the nuclear family unit. The construction boom required to build these complexes, along with the roads and rails to service them, drew a fresh wave of labor from rural prefectures. These shudan shushoku (groups of young school leavers employed en masse) arrived at Ueno Station by the trainload, providing the low-cost workforce that powered the manufacturing sector. By the late 1950s, the physical scars of the firebombing were being paved over, not by the garden city Ishikawa had envisioned, by a dense, vertical, and industrial metropolis preparing for its global debut.
The failure to implement land readjustment (kukaku seiri) in the immediate post-war years meant that this rapid growth occurred without adequate public space or road width. Landowners, desperate to secure their property rights in the chaos, resisted government attempts to pool and redistribute lots. As a result, the 1950s rebuilding solidified a pattern of narrow, winding streets in residential districts, surrounding the hardened arteries of major rail lines. This organic, unplanned density created a high-efficiency urban mesh where commercial and residential zones overlapped, a feature that would later be recognized as a key factor in Tokyo's economic vibrancy and low crime rates, even if it originated from administrative defeat.
By 1959, the selection of Tokyo as the host for the 1964 Summer Olympics forced the government to revisit the infrastructure deficits left by the budget cuts of 1949. The need to move athletes and tourists a second, more aggressive phase of construction that would define the decade. Yet, the foundation of modern Tokyo was laid in the frantic, concrete-pouring years of the 1950s, where the city metabolized the influx of American war dollars to pave over the ash of the Shitamachi. The recovery was a testament to a strategic pivot from imperial expansion to economic mercantilism, built upon the very ground that had been liquefied by napalm only a decade prior.
Subsurface Rail Network Density and Commuter Throughput Data
The transition of Tokyo from a pedestrian-centric feudal capital to a subterranean mechanized metropolis began not with a grand master plan, with a 2. 2-kilometer test track. In December 1927, the Tokyo Underground Railway Company inaugurated the Ginza Line between Ueno and Asakusa. Modeled on the London Underground by businessman Noritsugu Hayakawa, this single line shattered the Edo-era reliance on surface canals and palanquins. It introduced a new physics of urban movement where distance was measured in minutes rather than footsteps. By 2026, this initial segment had metastasized into the world's most complex subsurface transit web, comprising 13 primary lines and 286 stations split between two distinct operators: Tokyo Metro and the Toei Subway.
The engineering reality of this network defies the soft alluvial soil upon which Tokyo sits. Early construction relied on cut-and-cover methods that disrupted surface traffic, yet modern expansion necessitated deep-shield tunneling technologies to navigate beneath existing infrastructure. The Toei Oedo Line, fully operational by 2000, exemplifies this vertical frontier. It functions as a deep-level loop with stations like Roppongi situated 42. 3 meters the surface. To reduce tunnel cross-sections and construction costs, which still ballooned to approximately ¥1. 4 trillion, engineers used linear motor propulsion. This allowed for lower train profiles and tighter turning radii. Even with these innovations, the Oedo Line remains one of the most expensive civil engineering projects in Japanese history.
Operational density in Tokyo is achieved through a method largely absent in New York or London: reciprocal through-service, or chokutsu. Initiated in the 1960s with the Hibiya Line, this system allows suburban commuter trains from private carriers like Tobu, Seibu, and Odakyu to enter the subway network and continue directly to the city center without requiring passengers to transfer. This integration erases the boundary between the subway and the suburban rail network. It creates a singular heavy-rail organism that moves over 40 million passengers daily across the Greater Tokyo Area. The subway network alone handled approximately 8. 8 million daily passengers in 2024, a figure that rebounded to 95 percent of pre-pandemic levels by early 2025.
Table 5. 1: Evolution of Tokyo Subsurface Rail Metrics (1927, 2025)
Shinjuku Station serves as the apex of this throughput velocity. Recognized by Guinness World Records as the busiest transport hub globally, it processes an average of 3. 6 million passengers per day. This volume exceeds the entire population of Yokohama. The station acts as a hydraulic valve for the western suburbs. It funnels commuters from the Keio and Odakyu lines into the JR Yamanote loop and the subway grid. During the morning peak, headway between trains on lines like the Marunouchi shrinks to one minute and fifty seconds. This frequency is serious. Even a delay of thirty seconds can trigger a cascade of overcrowding that the issuance of "delay certificates" to thousands of late workers.
Congestion metrics remain the primary gauge of system health. The Ministry of Land, Infrastructure, Transport and Tourism (MLIT) defines 100 percent capacity as a state where all passengers can sit or hold a strap. In the economic bubble of the 1980s, rates frequently exceeded 250 percent. This density birthed the phenomenon of oshiya, or platform pushers, who physically compressed passengers into carriages. While the 2020 pandemic temporarily reduced these figures, 2024 data shows a resurgence. The Hibiya Line between Minowa and Iriya recorded a congestion rate of 163 percent. The JR Saikyo Line matched this figure. These numbers indicate that even with remote work trends, the physical centralization of Tokyo's workforce remains acute.
The financial structure of this network underwent a historic shift in October 2024. The Japanese national government and the Tokyo Metropolitan Government sold half their in Tokyo Metro Co. through an initial public offering. The listing valued the operator at approximately ¥1 trillion. This privatization aims to impose market discipline and generate capital for future capital expenditures. The immediate focus for 2025 and 2026 is not track expansion automation. Facing a serious labor absence, Tokyo Metro began testing "GoA 2. 5" automated train operations on the Marunouchi Line. This system allows trains to run automatically while a conductor remains in the cab for emergencies. It serves as a precursor to full driverless operations intended to sustain throughput as the workforce shrinks.
Asset Price Bubble Valuation and Subsequent Land Market Corrections
Post-1923 Earthquake Reconstruction and Street Grid Realignment
The commodification of Tokyo's land began not with the skyscrapers of the 1980s, with the Meiji Restoration. During the Edo period (1603, 1867), the shogunate allocated land based on feudal status, creating a rigid zoning system where daimyo estates occupied roughly 19% of the city while commoners packed into high-density lowlands. Value was tied to rice yield or social rank, not market forces. The Land Tax Reform of 1873 dismantled this structure, granting private ownership and establishing a price method that turned Tokyo's soil into a tradable financial asset. This shift laid the groundwork for the most volatile real estate pattern in modern history.
By the late 1980s, Tokyo experienced an asset price mania that economic. Fueled by the Bank of Japan's loose monetary policy and corporate zaitech (financial engineering), land prices in the capital surged to irrational levels. In 1989, the theoretical value of the Imperial Palace grounds, approximately 1. 15 square kilometers, exceeded the total real estate value of the entire state of California. Commercial districts saw even more extreme valuations. The corner lot of the Kyukyodo stationery store in Ginza traded at indices suggesting values over 60 million yen per square meter. At the peak in 1990, the average price of a new condominium in Tokyo reached 61. 2 million yen, a figure then considered unsustainable for the average salaryman.
The collapse was absolute. The Bank of Japan raised interest rates from 2. 5% in 1989 to 6% by 1990, pricking the bubble. Commercial land prices in Tokyo's central wards plummeted by approximately 87% between 1991 and 2005. This deflationary spiral created a "balance sheet recession" where corporations spent decades paying down debt rather than investing. The "land myth", the belief that Tokyo real estate would never fall, shattered, leaving a legacy of non-performing loans that paralyzed the banking sector until the early 2000s.
Market shifted again with the advent of Abenomics in 2012, the true acceleration occurred post-2020. Unlike the 1980s bubble, which was driven by domestic speculation, the 2024, 2026 surge is fueled by foreign capital and supply constraints. In the quarter of 2025, Tokyo emerged as the world's top city for real estate investment, attracting over $11 billion and surpassing New York. The depreciation of the yen made Japanese assets roughly 30% cheaper for dollar-based buyers compared to 2019, triggering a wave of acquisitions by entities such as Blackstone and Singaporean sovereign wealth funds.
Residential valuations in 2025 have eclipsed bubble-era records in nominal terms. Data from the Real Estate Economic Institute reveals that the average price of a new condominium in Tokyo's 23 wards hit 136. 1 million yen in 2025, more than double the 1990 peak. This price growth is driven by rising labor costs, material absence, and the proliferation of "Oku-shon" (condominiums costing over 100 million yen) marketed to dual-income power couples and foreign investors. In contrast to the 1980s, when interest rates were high, buyers in 2025 used floating mortgage rates 0. 5%, maintaining affordability for the wealthy even with high sticker prices.
The commercial sector exhibits a different equally tight trajectory. After a brief softening during the pandemic, Grade A office vacancy rates in Tokyo's central five wards are projected to drop 2% in 2026. Rents have reached 18-year highs as companies compete for premium, energy- space. While the 1989 market was characterized by negative yields (where borrowing costs exceeded rental returns), the 2026 market offers a positive yield spread. Prime office cap rates hover around 3. 2%, offering a margin over the rising 10-year Japanese Government Bond yields.
Metric
Bubble Peak (c. 1990)
Current Status (2025/2026)
Avg. New Condo Price (23 Wards)
61. 2 million yen
136. 1 million yen
Ginza Roadside Land Value (per sqm)
~60. 0 million yen (Market Est.)
48. 1 million yen (Rosenka)
Prime Office Vacancy
< 1. 0%
< 2. 0% (Forecast)
Primary Buyer Demographic
Domestic Corporations
Foreign Funds & Dual-Income Households
10-Year Govt Bond Yield
~7. 0%
~1. 0%, 1. 5%
As of early 2026, Tokyo faces a bifurcated reality. The asset class has fully recovered and surpassed historical highs, yet the market structure is fundamentally different. The 1980s valuation was a hallucination of infinite growth; the 2026 valuation is a product of global capital flows, currency arbitrage, and physical scarcity. While the nominal prices of the bubble era have been breached, the underlying mechanics suggest a market driven by yield-seeking institutional money rather than pure speculative mania.
Metropolitan Flood Control Systems and the G-Cans Discharge Channel
Tokyo exists in a state of perpetual hydraulic warfare. Geographically, the metropolis sits at the bottom of a massive drainage basin where the Kanto Plain tilts toward the Pacific, inviting the Tone, Ara, and Edo rivers to converge on the city's lowlands. Without aggressive geo-engineering, the wards of Koto, Edogawa, and Katsushika would revert to the marshland they were in the 16th century. The history of Tokyo's urban planning is defined by a violent struggle to force these waters eastward, away from the economic center, a process that began under the Tokugawa shogunate and continues with the multi-trillion-yen infrastructure projects of the 2020s.
The major intervention occurred in the early Edo period. The Tone River, originally draining directly into Tokyo Bay via the Sumida River, threatened the shogun's castle. Through the Tone River Eastward Diversion Project (Tone-gawa Tosens), engineers manipulated the river's course over sixty years, forcing it to discharge into the Pacific Ocean at Choshi, Chiba Prefecture. This protected the samurai districts of the Yamanote uplands doomed the Shitamachi lowlands to serve as the region's flood sink. This hydro-social hierarchy for centuries, with the eastern wards bearing the brunt of every major typhoon.
Modern flood control began in earnest following the Great Kanto Flood of August 1910. Two typhoons struck in rapid succession, overwhelming the Arakawa River and inundating 201 square kilometers of the capital. The disaster affected 1. 5 million people and submerged 270, 000 homes. The imperial government responded with the construction of the Arakawa Discharge Channel (Arakawa Hosuiro), a 22-kilometer artificial river designed to divert floodwaters away from the Sumida. Construction spanned two decades, from 1911 to 1930, and required the manual labor of three million workers who excavated enough soil to fill the Tokyo Dome roughly 18 times. This channel, known simply as the Arakawa River, remains the primary defensive line for the city's eastern flank.
The post-war era exposed the limitations of surface levees. Typhoon Kathleen struck in September 1947, breaching the Tone River embankments and killing over 1, 000 people. The floodwaters surged 30 kilometers south, reaching the Katsushika and Edogawa wards. This disaster coincided with a new, invisible threat: land subsidence. Between 1945 and 1970, rapid industrialization led to uncontrolled groundwater extraction. In the Koto delta, the ground sank by as much as 4. 5 meters. By 1970, large swathes of Tokyo sat sea level at high, creating "zero-meter zones" where drainage was impossible. The city had to rely on mechanical pumping to eject rainwater, a system easily overwhelmed by torrential downpours.
Recognizing that surface rivers could not contain the intensifying rainfall patterns of the late 20th century, the Ministry of Construction initiated the G-Cans project, officially the Metropolitan Area Outer Underground Discharge Channel (MAOUDC). Construction began in 1992 in Kasukabe, Saitama Prefecture, and concluded in 2006. This facility functions as an underground bypass, intercepting floodwaters from small and medium-sized rivers, the Naka, Kuramatsu, and Ootoshi, before they can inundate the Tokyo lowlands.
The engineering specifications of the G-Cans system are industrial in. The facility consists of five vertical containment silos, each 70 meters deep and 32 meters in diameter, large enough to house a space shuttle. These silos are linked by a 6. 3-kilometer tunnel bored 50 meters beneath National Route 16. When the rivers surge, water cascades into these silos and travels through the tunnel to the "Pressure Adjusting Water Tank," a subterranean cathedral measuring 177 meters long, 78 meters wide, and 18 meters high. The tank is supported by 59 concrete pillars, each weighing 500 tons, which prevent the ceiling from collapsing under the weight of the water table and dampen the hydraulic force of the incoming flood.
Technical Specifications: Metropolitan Area Outer Underground Discharge Channel (G-Cans)
Component
Metric Data
Operational Function
Tunnel Dimensions
6. 3 km length, 10m diameter
Connects 5 vertical silos; transfers water to the Edo River.
Vertical Silos
70m depth, 32m diameter
Intercepts overflow from Naka, Kuramatsu, and Ootoshi rivers.
Reduces water momentum before pump discharge; "Underground Temple."
The heart of the G-Cans is the drainage pump station, powered by four modified aircraft gas turbine engines. These engines generate a combined 14, 000 horsepower, driving pumps capable of ejecting 200 cubic meters of water per second into the Edo River. This discharge rate is equivalent to emptying a standard 25-meter swimming pool in a single second. During Typhoon Hagibis in October 2019, the system operated at full capacity, discharging approximately 12 million cubic meters of water, roughly the volume of ten Tokyo Domes, over three days. Data from the Ministry of Land, Infrastructure, Transport and Tourism (MLIT) indicates that without this intervention, the Naka River basin would have suffered catastrophic levee breaches similar to those seen in 1947.
Yet, the G-Cans system is not a panacea. It addresses river flooding offers limited protection against "guerrilla rainstorms", localized, high-intensity downpours that overwhelm the urban sewage capacity before water even reaches the rivers. To combat this, the Tokyo Metropolitan Government has invested heavily in localized underground reservoirs. The Kanda River / Ring Road No. 7 Underground Regulating Reservoir, completed in phases between 1997 and 2008, stores 540, 000 cubic meters of floodwater in a 4. 5-kilometer tunnel beneath the highway. This facility the flash floods that frequently paralyzed the Suginami and Nakano wards during the 1980s and 1990s.
As of 2026, the focus has shifted to the "Tokyo Resilience Project," a long-term infrastructure plan designed to harden the city against climate change. In June 2025, the national cabinet approved a 20 trillion yen budget for disaster resilience measures spanning 2026 to 2030. of this funding is allocated to expanding the underground river network. Current projects include the connection of the Shirako River reservoir to the Ring Road No. 7 system, creating a continuous 13-kilometer subterranean waterway capable of holding 1. 43 million cubic meters of water. This integration allows officials to shift floodwater loads between different river basins, balancing the system during uneven rainfall events.
The financial load of these defenses is immense, yet the cost of failure is higher. Simulations by the Central Disaster Management Council estimate that a massive flood in the Arakawa basin could cause over 2, 000 deaths and economic losses exceeding 60 trillion yen. The city's survival depends on the continuous operation of these pumps and tunnels. Tokyo is a dry-docked ship, kept afloat only by the constant expenditure of energy and concrete. The G-Cans and its sister reservoirs represent a refusal to accept the hydrological reality of the Kanto Plain, a mechanical imposition of order upon a that naturally wants to drown.
Waste Incineration Efficiency and Recycling Logistics
Strategic Bombing Damage Assessments and 1950s Rapid Rebuilding
The metabolic rate of Tokyo is defined not by its consumption, by its excretion. For over three centuries, the city has oscillated between a closed-loop organic ecosystem and a linear combustion engine, a transition driven by the sheer physics of density. In the Edo period (1603, 1868), the city did not manage waste; it sold it. The urban grid functioned as a biological factory where human output was the primary input for the surrounding agricultural hinterland. Historical ledgers from 1742 reveal that the Hitotsubashi daimyo house sold the rights to its night soil (shimogoe) to a farmer in Tama for 1, 500 daikon radishes or two ryo of gold. This was not disposal; it was a futures market for nitrogen and phosphorus. The demand for high-grade fertilizer from the protein-rich diets of the samurai class was so intense that by 1789, entrepreneurs petitioned for the rights to place urine collection vats on street corners, and magistrates recorded incidents of "night soil theft" where valuable excreta was stolen from tenement latrines.
This economic model created a city with sanitation standards that baffled European visitors, who were accustomed to the open cesspools of London and Paris. In Edo, the recycling rate for organic matter method 100 percent. The supply chain was precise: farmers transported vegetables into the city and returned with boats laden with shimogoe. Yet, this equilibrium collapsed with the Meiji Restoration and the introduction of chemical fertilizers from the West. As ammonium sulfate replaced human waste in the 1910s, the economic value of Tokyo's output plummeted to zero, then inverted into a costly liability. The biological loop was severed, turning a resource into "garbage" that required removal. By the post-war economic boom of the 1950s, Tokyo faced a sanitation emergency that physics could no longer ignore.
The breaking point arrived in the late 1960s, culminating in the "War on Garbage" (Gomi Senso) declared by Governor Ryokichi Minobe in September 1971. The conflict was geographic and class-based. For years, the wealthy, residential wards of the Yamanote uplands, specifically Suginami, generated massive volumes of trash refused to host incineration plants, citing environmental concerns. This forced the city to truck untreated waste to the Shitamachi lowlands, specifically Koto Ward, the gateway to the landfills in Tokyo Bay. The residents of Koto, subjected to thousands of daily truck trips, flies, and stench, reached their limit. In December 1971, the Koto Ward Assembly organized a physical blockade. They stopped garbage trucks at the ward border, turning back any vehicle originating from Suginami. The message was absolute: if you generate it, you burn it.
This insurrection forced a total restructuring of Tokyo's waste logistics, establishing the "Beneficiary Pays" principle that governs the metropolis today. The result is the Clean Authority of Tokyo 23, a specialized union that operates 21 incineration plants within the 23 special wards. Unlike other global cities that export waste to distant landfills, Tokyo incinerates combustible trash within walking distance of the households that produce it. The architecture of these facilities reflects a strategy of concealment and integration. The Naka Incineration Plant in Hiroshima (designed by Yoshio Taniguchi, who also designed the MoMA renovation) and the Toshima Incineration Plant (integrated with a health center and pool heated by the furnace) exemplify this doctrine. The Shin-Koto Incineration Plant, the largest in the network, processes 1, 800 tons per day, generating 50, 000 kW of electricity, enough to power 130, 000 households.
The engineering inside these plants represents a shift from simple combustion to high-tech volume reduction. Modern stoker furnaces and fluidized bed incinerators operate at temperatures exceeding 800°C to destroy dioxins. The residual ash, once dumped directly into the bay, undergoes a secondary process in ash melting furnaces. By heating the ash to over 1, 200°C, the material is vitrified into slag, reducing its volume by half and trapping heavy metals in a glass-like matrix. This slag is then repurposed as construction aggregate for asphalt and concrete, returning a fraction of the waste to the urban structure. As of 2024, the Clean Authority reports that this thermal treatment reduces the final landfill volume to approximately 3 percent of the original waste mass.
Tokyo 23 Wards Waste Incineration & Power Generation Metrics (2024 Estimate)
Metric
Value
Notes
Total Incineration Plants
21
Operated by Clean Authority of Tokyo 23
Daily Processing Capacity
~12, 000 Tons
Varies by maintenance schedules
Power Generation Efficiency
~20-25%
High-efficiency plants reach>25%
Annual Power Output
~1. 3 Billion kWh
Equivalent to ~300, 000 households
Ash Volume Reduction
1/20 to 1/40
Via incineration and slag melting
Furnace Temperature
850°C, 1, 200°C
Required for dioxin destruction and slagging
Yet, the efficiency of this system masks a controversial classification in recycling statistics. Japan frequently cites a plastic recycling rate of around 85 to 87 percent. A closer examination of 2023-2025 data reveals that nearly 62 percent of this figure is "Thermal Recycling", a euphemism for burning plastic to generate heat and electricity. While this recovers energy, it is not recycling in the material sense. The reliance on thermal recycling is a direct consequence of the China National Sword policy of 2018, which banned plastic waste imports and forced Japan to process its own polymers. With limited domestic capacity for mechanical recycling (reprocessing plastic into plastic), incineration became the default solution. The carbon emissions from this process are significant. To counter this, Hitachi Zosen and the Clean Authority launched a pilot project in February 2024 at the Shinagawa Incineration Plant to test carbon capture technology directly on flue gas, aiming to neutralize the climate impact of this "recycling" method.
The final destination for the non-combustible residue is the Central Breakwater Outer Landfill Site and the New Sea Surface Disposal Site in Tokyo Bay. These artificial islands are the terminal point of the city's metabolism. The "Landfill of Dreams" (Yume-no-shima), which filled up in the 1960s, is a park, the current sites are finite. Estimates from the Tokyo Metropolitan Government suggest the remaining capacity be exhausted within 50 years at current rates. The engineering required to maintain these islands is immense; the "sandwich method" waste with soil to prevent fires and pest infestations, while deep steel pilings prevent leachate from contaminating the bay. The urgency is palpable: there is no more sea to reclaim without interfering with shipping lanes or causing severe ecological damage. The city must therefore rely on the "3R" policies (Reduce, Reuse, Recycle) not as an environmental virtue, as a spatial need.
By 2026, the strategy has shifted toward "Carbon Neutrality in Waste." The integration of AI-driven sorting robots in recycling centers aims to extract more plastics before they reach the furnace, shifting the balance from thermal to material recycling. Simultaneously, the cement industry absorbs a portion of the incineration ash, using it as a raw material substitute for clay in the production of Eco-Cement. This creates a modern, albeit industrial, version of the Edo period's closed loop: the city's buildings are, in part, constructed from the ashes of its own refuse. The pattern continues, driven by the relentless pressure of 14 million residents existing in a space that cannot expand.
Energy Grid Stress Tests and Nuclear Power Reliance
Tokyo's metabolic rate is measured in terawatt-hours, a relentless consumption that has mutated from the organic carbon pattern of the Edo period to a brittle reliance on imported uranium and liquefied natural gas. In the 18th century, the city's energy budget was solar-derivative: charcoal from managed forests, whale oil for lamps, and human muscle fueled by rice. This closed-loop system, while resource-constrained, was immune to geopolitical shocks. By 2026, that autonomy had. The modern capital operates on a razor-thin reserve margin, its stability dependent on the controversial reactivation of nuclear reactors and the volatile spot prices of the global gas market.
The trajectory toward fragility began with the founding of the Tokyo Electric Light Company in 1883, which inaugurated the city's addiction to centralized power. Following the oil shocks of the 1970s, the Japanese government and Tokyo Electric Power Company (TEPCO) engineered a strategic pivot to nuclear energy to sever dependence on Middle Eastern oil. This policy constructed a "nuclear village" of reactors along the coasts of Fukushima and Niigata, designed to feed the voracious demand of the capital. By 2010, nuclear power supplied approximately 30 percent of Japan's electricity, with TEPCO's Kashiwazaki-Kariwa plant, the world's largest nuclear facility, serving as the baseload anchor for the Tokyo metropolitan area.
The Great East Japan Earthquake of March 11, 2011, shattered this architecture. The subsequent meltdowns at Fukushima Daiichi did not release radiation; they severed Tokyo's primary artery of cheap, consistent power. In the immediate aftermath, TEPCO enforced setsuden (power-saving) measures and rolling blackouts affecting 18 million customers, a humiliation for a city that prided itself on 24-hour efficiency. For the decade, Tokyo reverted to a fossil-fuel diet, burning coal and LNG at breakneck rates to fill the nuclear void. This substitution resulted in a massive wealth transfer from Japanese ratepayers to foreign gas exporters, with trade deficits ballooning alongside electricity bills.
The fragility of this post-Fukushima grid was exposed during the "power crunch" of March 2022. A magnitude 7. 4 earthquake off the coast of Fukushima knocked thermal plants offline just as a cold snap hit Tokyo. On March 22, 2022, the grid's reserve margin, the buffer needed to prevent blackouts, plummeted to near zero. The Ministry of Economy, Trade and Industry (METI) issued its -ever "Power Supply Warning," forcing elevators to stop and neon signs to darken in Ginza. The grid held, the event proved that Tokyo was operating without a safety net.
By 2024 and 2025, the stress tests shifted from winter freezes to summer heatwaves. As temperatures in the Kanto plain repeatedly breached 35°C (95°F), air conditioning demand pushed the grid to its physical limit. TEPCO Power Grid projected absence for the fiscal years 2025 and 2026, citing the retirement of aging thermal plants that were no longer economically viable essential for peak capacity. The government's "Green Transformation" (GX) policy, ostensibly a decarbonization strategy, functioned in practice as a mandate to restart idled nuclear reactors to prevent economic strangulation.
This pressure culminated in the pivotal events of early 2026. On January 20, 2026, TEPCO initiated the restart sequence for Unit 6 of the Kashiwazaki-Kariwa Nuclear Power Plant, marking the time the utility had generated nuclear power since the 2011 disaster. Commercial operations commenced in late February 2026, following approval from the Nuclear Regulation Authority and the acquiescence of the Niigata governor. The restart was not a triumph of public relations a logistical need; without it, Tokyo faced the certainty of brownouts and industrial shutdowns.
The following table details the shift in Tokyo's power generation mix and the tightening of reserve margins across three serious eras:
Metric
2010 (Pre-Disaster)
2022 (The Crunch)
2026 (The Restart)
Nuclear Share
~28%
0%
~8% (Projected)
Fossil Fuel Dependence
~60%
~75%
~65%
Reserve Margin (Min)
8-10%
0-3% (serious)
4-5%
Primary Stressor
Industrial Growth
Fuel Imports / Quakes
AI Data Centers / Heat
The 2026 restart of Kashiwazaki-Kariwa Unit 6 provides a temporary reprieve, yet a new parasitic load has emerged: artificial intelligence. The proliferation of hyperscale data centers in the Greater Tokyo Area is driving a surge in power consumption that defies previous forecasts. Estimates suggest that by 2030, data centers could consume as much electricity as the entire residential sector of a mid-sized prefecture. TEPCO faces a "Watt-Bit" conflict, where the baseload power provided by restarted nuclear units is immediately swallowed by the server farms training large language models. The grid is no longer just battling the climate; it is battling the computational intensity of the digital economy.
Tokyo's energy security remains an illusion maintained by high- engineering. The city has traded the localized risks of Edo-era fires for the widespread risks of grid collapse and nuclear containment. While the lights remain on in 2026, the underlying infrastructure is stretched taut, vibrating with the tension between physical limits and infinite demand.
Demographic Inversion and Labor Force Automation Statistics (2000, 2026)
Subsurface Rail Network Density and Commuter Throughput Data
The demographic trajectory of Tokyo between 1700 and 2026 represents a shift from organic metabolic stabilization to mechanical terminal contraction. In the Edo period (1603, 1867), the city maintained a population of roughly one million through a brutal yet equilibrium of resource management and, when necessary, mabiki (infanticide). By contrast, modern Tokyo functions as a demographic centrifuge. While the metropolis reached a population of 14. 2 million in 2025, this figure masks a hollow core. The capital no longer grows through natural increase; it expands solely by absorbing the youth of shrinking rural prefectures. This phenomenon, classified by sociologists as the "Tokyo Black Hole," accelerated in the mid-2020s, creating a city that is simultaneously overcrowding and dying.
Statistical data from the Ministry of Health, Labor, and Welfare confirms that Tokyo's internal reproductive engine stalled long before the current emergency. By 2023, Tokyo's Total Fertility Rate (TFR) dropped to 0. 99, the time any prefecture fell the singular replacement level. Preliminary data for 2024 and 2025 indicates a further slide to 0. 96. This is not a decline; it is a mathematical guarantee of extinction without external input. In 2024 alone, Japan recorded fewer than 687, 000 births nationally, the lowest figure since records began in 1899. Tokyo's contribution to this collapse is distinct: it offers the highest economic density the most hostile environment for family formation, sterilizing the labor force it attracts from the countryside.
The "2025 Problem", a term used by policy planners to designate the year the post-war Baby Boomer generation (born 1947, 1949) shared reached the age of 75, hit the capital with precise force. As of 2026, approximately 23 percent of Tokyo's residents are over 65. While this is lower than the national average of 29. 3 percent, the absolute number of elderly in the Greater Tokyo Area creates a medical load that physical infrastructure cannot support. The ratio of working-age contributors to elderly dependents has inverted, forcing the metropolitan government to abandon traditional care models in favor of automation and foreign labor importation.
Labor absence ceased to be a theoretical risk in April 2024, when the "2024 Logistics Problem" came into effect. New overtime regulations capped truck driver hours to 960 per year, intended to improve working conditions. The immediate result was a 14 percent reduction in transport capacity. By early 2026, this supply chain constriction caused an estimated 16 trillion yen in lost economic opportunity. Supermarkets in the Kanto region faced intermittent absence, and construction projects in Tokyo Bay stalled as materials could not be moved. The bankruptcy rate for logistics and construction firms spiked by 60 percent in fiscal 2024, driven by an inability to secure personnel even with wage hikes of 5. 25 percent, the highest in three decades.
To prevent widespread failure, Tokyo has pivoted to a reliance on non-Japanese labor that would have been legally impossible in the 20th century. As of late 2025, the number of foreign residents in Tokyo reached a record 738, 946, accounting for nearly 20 percent of Japan's total foreign population. The demographic composition of wards like Shinjuku and Edogawa has transformed, with Vietnamese and Nepali nationals becoming the primary workforce for convenience stores, logistics centers, and elder care facilities. The "Specified Skilled Worker" visa program, expanded aggressively in 2024 and 2025, admits hundreds of thousands of workers specifically to patch holes in the construction and nursing sectors. The myth of a homogeneous Tokyo has dissolved; the city functions only because of this imported metabolic energy.
Tokyo Labor & Demographic Metrics (2020, 2026)
Metric
2020 Data
2023 Data
2026 (Est/Current)
Total Population (Tokyo)
14. 04 Million
14. 09 Million
14. 20 Million
Total Fertility Rate (Tokyo)
1. 12
0. 99
0. 96
Foreign Residents (Tokyo)
577, 000
627, 000
738, 900+
Elderly Population (>65)
22. 1%
22. 7%
23. 4%
Logistics Capacity Shortfall
N/A
N/A
14. 2%
Automation has moved from experimental pilot programs to mandatory infrastructure. In the elder care sector, the adoption of monitoring sensors reached 30 percent by 2025, though physical assist robots remain expensive and rare (0. 5 percent adoption for toileting aids). The labor gap in construction is being bridged by autonomous heavy and drone surveying, particularly in the redevelopment zones of Nihonbashi and Toranomon. In the retail sector, major convenience store chains like Lawson and FamilyMart accelerated the rollout of unstaffed, avatar-operated stores in 2025 to circumvent the chronic absence of night-shift workers. These systems do not replace humans to save money; they replace humans because no humans are available to hire.
The historical irony is sharp. Edo's planners in 1700 feared overpopulation and fire; Tokyo's planners in 2026 fear silence and stagnation. The city has entered a phase of "managed survival," where the maintenance of urban functions depends entirely on the speed of automation adoption and the inflow of foreign workers. The demographic inversion is complete. The pyramid has flipped, and the weight of the silver top crushes the narrowing base.
Shinjuku Station Structural Expansions and Passenger Flow Engineering
Shinjuku Station is not a railway facility; it is a biological pump of terrifying capacity. Every twenty-four hours, this single infrastructure node processes approximately 3. 6 million passengers, a figure that rivals the entire population of Yokohama. It holds the Guinness World Record for the busiest transport terminal on Earth, a title it defends through a chaotic, organic architecture that defies traditional urban planning. The station does not function through direct design through a brute-force engineering of human flow, a method that has evolved from a muddy, rain-soaked platform in 1885 to a multi-level subterranean labyrinth in 2026.
The origins of this behemoth lie in the manure trade of the Edo period. In 1698, the shogunate established Naito-Shinjuku as a post station on the Koshu Kaido highway. It was a transit point for "night soil", human waste collected from the city to fertilize the farmlands of the Musashino plateau. For nearly two centuries, the area remained a gritty, peripheral stopover. When the station officially opened in 1885 as part of the Akabane-Shinagawa line ( the Yamanote Line), it was a commercial failure. Records indicate that on its day, the station served only 50 passengers. Rain frequently reduced ridership to zero. The station sat in a thicket of trees, disconnected from the urban pulse of Tokyo, a clear contrast to the concrete density that defines it today.
The Great Kanto Earthquake of 1923 served as the primary catalyst for Shinjuku's explosive growth. As the fires of the low city (Shitamachi) raged, refugees fled to the stable loams of the western Yamanote plateau. Shinjuku transformed overnight from a transit depot into a terminal destination. By the 1930s, the station had become a serious junction for the Chuo, Keio, and Odakyu lines. The postwar era accelerated this expansion, turning the station into a magnet for black markets and, later, massive commercial development. The 1960s saw the construction of the station's defining brutalist features, including the West Exit Plaza designed by Junzo Sakakura, which became a focal point for student protests before being reclassified as a "passage" to legally ban static gatherings.
Structurally, the station is a disaster of ad-hoc engineering. Unlike Tokyo Station, which retains a semblance of master planning, Shinjuku grew like a coral reef, adding of concrete upon existing to accommodate rising of commuters. The result is the "Shinjuku Dungeon," a colloquialism that refers to the station's notorious complexity. The complex houses over 200 exits and 36 platforms across multiple operators, JR East, Odakyu, Keio, Tokyo Metro, and Toei Subway. The absence of vertical integration forces passengers into long horizontal migrations, navigating a maze of tunnels that absence consistent signage or logical orientation.
The engineering challenge of Shinjuku is not keeping the trains moving, keeping the humans from crushing one another. The station employs a distinct flow strategy. During the morning rush, the "oshiya" (pushers) are less common than in the 1980s, replaced by precise timetable synchronization that ensures platforms clear seconds before the payload of commuters arrives. The margin for error is nonexistent. A delay of three minutes on the Chuo Line triggers a cascade of congestion that fills the platforms to dangerous densities. To mitigate this, JR East has progressively installed automatic platform gates, a project that continued through 2025, forcing a rigid discipline on passenger boarding processes.
Shinjuku Station: The Metrics of a Megastructure (1885, 2026)
Year
Daily Passengers
Key Structural Development
1885
~50
Station opens on Akabane-Shinagawa Line.
1925
~50, 000
Post-earthquake migration swells western suburbs.
1966
~1, 000, 000
West Exit Plaza and Station Building completed.
2018
3, 590, 000
Peak ridership recorded (Guinness Record).
2020
2, 800, 000
East-West Free Passage opens; pandemic dip.
2026
3, 450, 000
West Exit redevelopment; Odakyu tower construction.
The most significant engineering intervention in recent history occurred in July 2020 with the opening of the East-West Free Passage. For decades, the station acted as a physical wall, severing the Kabukicho side (East) from the skyscraper district (West). Pedestrians wishing to cross had to either buy a ticket to walk through the station or take a long detour via the "Piss Alley" underpass or the southern deck. The 2020 project involved excavating a 25-meter-wide, 100-meter-long tunnel directly beneath the active tracks. Engineers executed this while 3, 000 trains passed overhead daily, a feat of surgical construction that pierced the station's impenetrable core. This passage reduced congestion at the ticket gates and unified the pedestrian flow of the district.
As of early 2026, Shinjuku Station is in the throes of its "Grand Terminal" redevelopment, a twenty-year project scheduled for completion in 2046. The is currently defined by demolition and steel skeletons. The iconic Odakyu Department Store at the West Exit, a symbol of the 1967 commercial boom, has been dismantled. In its place, heavy is driving piles for a new 48-story, 260-meter skyscraper set to open in 2029. This tower eclipse the Tokyo Metropolitan Government Building, altering the skyline permanently. Simultaneously, the Keio Department Store is slated for demolition, with its replacement tower expected to rise by the 2040s.
The current state of the station is one of controlled chaos. Temporary walls of plywood and white tarp guide passengers through shifting corridors. The "Grand Terminal" vision aims to dissolve the blocks between the station and the city, creating a pedestrian-centric deck system that floats above the tracks. Yet, the reality on the ground in 2026 is a construction zone of immense proportions. The labyrinth has not been solved; it has been complicated by the necessary violence of renewal. Passengers navigate a hybrid space of old tunnels and gleaming new concourses, a physical manifestation of a city that refuses to stop metabolizing its own history.
This perpetual state of construction has led locals to compare Shinjuku Station to the Sagrada Família, an unfinished masterpiece that is always becoming something else. The comparison is apt. The station is not a static building a process. It adapts to the economic and demographic pressures of Tokyo with a plasticity that is both impressive and terrifying. The flow of 3. 6 million people dictates the architecture, wearing down stone steps and demanding wider tunnels, forcing engineers to dig deeper and build higher. In Shinjuku, the human flood is the primary force of nature, and the station is the channel built to contain it.
2026 Urban Heat Island Mitigation and Green Infrastructure Projects
By February 2026, the thermal profile of Tokyo resembles a geological formation more than a biological habitat. Data from the Japan Meteorological Agency confirms that while the global average temperature rose by approximately 0. 7°C over the last century, Tokyo's average surged by 3. 0°C. Two-thirds of this increase is directly attributable to the Urban Heat Island (UHI) effect, a phenomenon where waste heat from air conditioning, concrete retention, and vehicular exhaust creates a localized atmospheric oven. The city experiences over 50 "tropical nights" per year, where temperatures never drop 25°C, compared to fewer than 15 in the 1980s. This shift has fundamentally altered the metabolic rate of the metropolis, turning summer nights into health risks for the elderly and forcing a reliance on energy-intensive cooling that further feeds the pattern.
The physical architecture of this heat trap lies in the destruction of Edo-era wisdom. The Tokugawa shogunate designed Edo with "hirokoji" (firebreaks) and an extensive network of canals that functioned as wind corridors, allowing cool breezes from Tokyo Bay to penetrate inland. Modern urban planning dismantled these respiratory channels. The most egregious example stands at Shiodome. Re-zoned in the early 2000s, this district allowed the construction of a massive wall of skyscrapers exceeding 200 meters in height. These towers severed the "Kaze no Michi" (Wind route), blocking the prevailing sea breeze from reaching the sweltering districts of Shimbashi and Toranomon. Wind tunnel tests and simulation data from 2020 to 2025 confirm that wind speeds in inland areas dropped by up to 50% following the completion of the Shiodome barrier, the air and trapping particulate matter.
In 2026, the conflict between profit-driven development and environmental need reached its zenith with the Jingu Gaien redevelopment project. even with vehement opposition from residents, UNESCO advisory bodies, and the late musician Ryuichi Sakamoto, developers led by Mitsui Fudosan proceeded with a plan to raze a century-old park district. The project, approved by Governor Yuriko Koike's administration, involves felling nearly 1, 000 trees, planted over 100 years ago, to erect a pair of 190-meter skyscrapers and a new baseball stadium. While the developers promised to "green" the area by planting new saplings, the volumetric loss of mature canopy represents an immediate reduction in transpiration cooling. A mature ginkgo or camphor tree can evaporate hundreds of liters of water daily, cooling the surrounding air by 3°C to 5°C. Replacing these biological engines with glass and steel, even with token rooftop gardens, creates a net thermal gain for the district. The Jingu Gaien case exposes the hollow core of Tokyo's "green" strategy: existing, functional ecosystems are sacrificed for construction contracts, replaced by engineered greenery that requires decades to reach equivalent cooling capacity.
To counter the rising mercury without halting vertical expansion, the Tokyo Metropolitan Government (TMG) has poured billions of yen into technical surface treatments. The primary weapon in this arsenal is water-retentive pavement. Unlike standard asphalt, which can reach surface temperatures of 60°C in direct sunlight, these porous ceramic-composite blocks absorb moisture during rainfall or artificial sprinkling and release it via evaporation. As of the fiscal year ending March 2026, TMG has installed approximately 210 kilometers of this "cool pavement" on prefectural roads, aiming for a target of 245 kilometers by 2030. Field data indicates these surfaces stay roughly 10°C cooler than conventional asphalt. Yet, the cost is prohibitive, roughly 30% higher than standard paving, and the pores frequently clog with dust, reducing effectiveness after a few years. It is a band-aid solution applied to a city that has paved over 85% of its natural soil.
The TMG budget for 2026 allocates a record ¥760. 9 billion to the "Tokyo Resilience Project," a portion of which funds these green infrastructure initiatives. This includes subsidies for "wall greening" and rooftop gardens, mandatory for new buildings with a footprint exceeding 1, 000 square meters since 2001. Compliance is high, yet the impact is localized. Infrared aerial surveys conducted in August 2025 reveal that while individual green roofs remain cool, they fail to lower the ambient air temperature at street level in deep urban canyons. The heat generated by the building's HVAC systems, vented onto the roof or into the alley, frequently negates the cooling provided by the sedum mats. The physics of the city are fighting a losing war against its own density.
Tokyo Urban Heat Island Metrics & Mitigation Status (2026)
Metric
Historical Baseline (1900/1980)
2026 Status
Change / Impact
Avg. Annual Temp
13. 5°C (1900)
16. 5°C
+3. 0°C (3x global avg)
Tropical Nights (>25°C)
< 15 days (1980)
> 50 days
Severe health risk increase
Green Coverage Ratio
~80% (Edo Era)
~19% (Central 23 Wards)
Loss of evapotranspiration
Cool Pavement
0 km
~210 km
Surface temp -10°C (localized)
Wind Speed (Inland)
5. 0 m/s (Summer avg)
2. 5 m/s
Blocked by skyscraper walls
The administration's reliance on "Green Transformation" (GX) bonds and private sector incentives has created a disjointed patchwork of greenery rather than a ecological network. The "Green Tokyo" fund, established to support these projects, prioritizes visible, high-tech interventions over the preservation of existing wild spaces. For instance, the redevelopment of the Hibiya Park area involves "regenerating" the park by removing old-growth trees to accommodate underground infrastructure and new event spaces, a move that mirrors the Jingu Gaien logic. The definition of "green" has shifted from biological function to aesthetic amenity. A potted plant in a concrete plaza counts toward the quota, it does not perform the work of a forest floor.
Water management remains another serious component of the 2026 strategy. Edo relied on a -fed water system and open canals. Modern Tokyo buries its water. The reclamation of the outer moats and the restoration of the Nihonbashi River, long covered by the Shuto Expressway, are flagship projects intended to bring water back to the surface. The removal of the expressway over Nihonbashi is underway, with a completion target well into the 2030s. Until then, the river remains a shaded, concrete-lined drainage ditch rather than a cooling device. The "Furukawa Reservoir" project and other underground flood tunnels protect the city from typhoons do nothing to cool the surface. The disconnection between flood control (burying water) and heat mitigation (exposing water) remains a policy gap that the 2026 budget attempts to with "mist generators" in public parks, machines that spray potable water into the air to cool pedestrians, an energy-intensive simulation of a natural breeze.
The failure to protect the "Kaze no Michi" represents the single greatest planning error of post-war Tokyo. While German cities like Stuttgart legally protect wind corridors, preventing construction that would block air flow, Tokyo treats air rights as a commodity. The Shiodome disaster proved that once a wind block is built, it is permanent. The heat trapped behind these towers accumulates, creating a dome of stagnant air that concentrates pollutants. In 2026, new guidelines suggest "wind-conscious" design for future towers, requiring gaps or aerodynamic shapes, these are voluntary recommendations, not binding laws. The real estate lobby, and deeply entrenched in TMG politics, resists any zoning that reduces rentable floor area for the sake of invisible air currents.
, the 2026 status of Tokyo's heat mitigation is a testament to technological hubris. The city attempts to engineer its way out of a problem caused by over-engineering. We pave the earth, then invent expensive pavement to mimic the soil we covered. We build walls of glass that block the wind, then install electric fans to move the air. We cut down century-old forests to build stadiums, then plant saplings in pots to claim sustainability. The data shows a city that is getting hotter, denser, and more expensive, trading its long-term climate resilience for short-term construction stimulus. Unless the fundamental logic of zoning and density is challenged, restoring the firebreaks and canals of Edo not as museum pieces as functional urban organs, Tokyo continue to cook in its own juices, a gilded cage of heat-trapping glass.
Why it matters: Fossil fuel industry's financial influence on Australian Federal Election 2025 Impact of donations on energy and economic policies The 2025 Australian Federal Election was not…
What do we know about Edo Era Fire Suppression and Sanitation Zoning?
Edo, the progenitor of modern Tokyo, functioned as a high-density combustible engine where urban planning was dictated by the physics of fire and the economics of waste. By 1721, the shogunate census recorded a population exceeding one million, a density that outstripped London and Paris.
What do we know about Meiji Industrialization and Waterworks Modernization?
The transition from Edo to Tokyo in 1868 was a rebranding of the software while the hardware remained dangerously obsolete. The imperial capital inherited a wooden urban grid that was biologically hazardous.
What do we know about Post- Earthquake Reconstruction and Street Grid Realignment?
The Great Kanto Earthquake of September 1, 1923, functioned as a violent urban reset. While the tectonic shift shattered the city's bones, the subsequent firestorm, which consumed 44 percent of Tokyo and killed over 105, 000 people, erased its skin.
What do we know about Strategic Bombing Damage Assessments and 1950s Rapid Rebuilding?
The physical annihilation of Tokyo in 1945 was not a byproduct of general combat the result of a calculated engineering problem solved by the United States Army Air Forces. Planners identified the city's traditional wooden architecture as a specific vulnerability, distinct from the brick and stone of German.
What do we know about Subsurface Rail Network Density and Commuter Throughput Data?
The transition of Tokyo from a pedestrian-centric feudal capital to a subterranean mechanized metropolis began not with a grand master plan, with a 2. 2-kilometer test track.
What do we know about Asset Price Bubble Valuation and Subsequent Land Market Corrections?
The commodification of Tokyo's land began not with the skyscrapers of the 1980s, with the Meiji Restoration. During the Edo period (1603, 1867), the shogunate allocated land based on feudal status, creating a rigid zoning system where daimyo estates occupied roughly 19% of the city while commoners packed into high-density lowlands.
What do we know about Metropolitan Flood Control Systems and the G-Cans Discharge Channel?
Tokyo exists in a state of perpetual hydraulic warfare. Geographically, the metropolis sits at the bottom of a massive drainage basin where the Kanto Plain tilts toward the Pacific, inviting the Tone, Ara, and Edo rivers to converge on the city's lowlands.
What do we know about Waste Incineration Efficiency and Recycling Logistics?
The metabolic rate of Tokyo is defined not by its consumption, by its excretion. For over three centuries, the city has oscillated between a closed-loop organic ecosystem and a linear combustion engine, a transition driven by the sheer physics of density.
What do we know about Energy Grid Stress Tests and Nuclear Power Reliance?
Tokyo's metabolic rate is measured in terawatt-hours, a relentless consumption that has mutated from the organic carbon pattern of the Edo period to a brittle reliance on imported uranium and liquefied natural gas. In the 18th century, the city's energy budget was solar-derivative: charcoal from managed forests, whale oil for lamps, and human muscle fueled by rice.
What do we know about Demographic Inversion and Labor Force Automation Statistics?
The demographic trajectory of Tokyo between 1700 and 2026 represents a shift from organic metabolic stabilization to mechanical terminal contraction. In the Edo period (1603, 1867), the city maintained a population of roughly one million through a brutal yet equilibrium of resource management and, when necessary, mabiki (infanticide).
What do we know about Shinjuku Station Structural Expansions and Passenger Flow Engineering?
Shinjuku Station is not a railway facility; it is a biological pump of terrifying capacity. Every twenty-four hours, this single infrastructure node processes approximately 3.
What do we know about Urban Heat Island Mitigation and Green Infrastructure Projects?
By February 2026, the thermal profile of Tokyo resembles a geological formation more than a biological habitat. Data from the Japan Meteorological Agency confirms that while the global average temperature rose by approximately 0.
Why it matters: The traditional "Taiwan Silicon Semiconductor Shield" is no longer effective in deterring Chinese aggression. A shift in U.S. policy towards onshoring semiconductor production marks a…
Why it matters: Migrant workers contribute significantly to the global labor force, but face varying rights and protections, leaving them vulnerable to exploitation. International frameworks and national laws…
Why it matters: Online marketplaces like Amazon are taking an increasing share of small retailers' revenue, impacting their profits. Small businesses are facing higher fees, advertising costs, and…
Why it matters: Constitutional amendments in Africa are eroding democratic progress by allowing presidents to extend their terms through legal loopholes. 30 out of 54 African countries now…
Why it matters: US-funded news organizations, like Voice of America and Radio Free Europe/Radio Liberty, face existential threat from funding cuts. These news sites reach a global audience…
Why it matters: China's property giant Evergrande's collapse in 2023-2024 led to a crisis of unfinished homes, financial uncertainty, and angry homeowners. The fallout from Evergrande's collapse has…
Get updates on this place
Get verified alerts when this file is updated (verification required).